OptionHawk1. What makes the script original?
• Unique concept: It integrates a Keltner based custom supertrend with a multi-EMA energy visualization, ATR based multi target management, and on chart options (CALL/PUT) trade signals—creating a toolkit not found in typical public scripts.
• Innovative use: Instead of off the shelf indicators, it reinvents them:
• Keltner bands used as dynamic Supertrend triggers.
• Fifteen EMAs layered for “energy” zones (bullish/bearish heatmaps).
• ATR dynamically scales multi-TP levels and stop loss.
These are creatively fused into a unified signal and automation engine.
________________________________________
2. What value does it provide to traders?
• Clear entries & exits: Labels for entry price/time, five TP levels, and SL structure eliminate guesswork.
• Visualization & automation: Real-time bar coloring and energy overlays allow quick momentum reads.
• Targeted to common pain points: Many traders struggle with manual TP/SL and entry timing—this automates that process.
• Ready for real use: Just plug into intraday (e.g., 5 min) or swing setups; no manual calculations. Signals are actionable out of the box.
________________________________________
3. Why invite only (worth paying)?
• Proprietary fusion: Public indicators like Supertrend or EMA are common—but your layered use, ATR based scaling, and label logic are exclusive.
• Auto-generated options format: Unique labeling for CALL/PUT, with graphical on chart signals, isn’t offered freely elsewhere.
• Time-saver & edge-provider: Saves traders hours of configuration and enhances consistency—worth the subscription cost over piecing together mash ups.
________________________________________
4. How does it work?
• Signal backbone: Custom supertrend uses Keltner bands crossing with close for direction, filtered by trend direction EMAs.
• Multi time logic: Trend defined by crossover of price over dynamic SMA thresholds built from ATR.
• Energy bar-colors/EMAs: 15 fast EMAs color-coded green/red to instantly show momentum.
• Entry logic: “Bull” when close crosses above supertrend; “Bear” when crosses below.
• Risk management: SL set at previous bar; up to 5 ATR scaled targets (or percentage based).
• Options formatted alerts: CALL/PUT labels with ₹¬currency values, embedded timestamp, SL/TP all printed on the chart.
________________________________________
5. How should traders use it?
• Best markets & timeframes: Ideal for intraday / low timeframe (1 15m) setups and 1 hour swing trades in equities, indices, options.
• Conditions: Works best in trending or volatility driven sessions—visible via Keltner bands and EMA energy alignment.
• Recommended combo: Use alongside volume filters or broader cycles; when supertrend & energy EMAs align, validation is stronger.
________________________________________
6. Proof of effectiveness?
• On chart visuals: Entry/exit labels, confirmed labels, TP and SL markers make past hits obvious.
• Real trade examples: Highlighted both bull & bear setups with full profit realization or SL hits.
• Performance is paint tested: Easy to showcase historic signals across multiple tickers.
• Data-backed: Users can export chart data to calculate win rate and avg return per trade.
________________________________________
Summary Pitch:
OptionHawk offers a holistic, execution-ready trading tool:
1. Proprietary blend of Keltner-supertrend and layered EMAs—beyond standard scripts.
2. Automates entries, multi-tier targets, SL, and options-format labels.
3. Visual energy overlays for quick momentum readings.
4. Use-tested in intraday and swing markets.
5. Installs on chart and works immediately—no setup complexity.
It's not a public indicator package; it's a self-contained, plug and play trade catalyst—worth subscribing for active traders seeking clarity, speed, and structure in their decision-making.
6. While OptionHawk is designed for clarity and structure, no script can predict the market. Always use with discretion and proper risk management.
---------------------------------------------------------------------------------------------------------------------
OptionHawk: A Comprehensive Trend-Following & Volatility-Adaptive Trading System
The "OptionHawk" script is a sophisticated trading tool designed to provide clear, actionable signals for options trading by combining multiple technical indicators and custom logic. It aims to offer a holistic view of market conditions, identifying trend direction, momentum, and potential entry/exit points with dynamic stop-loss and take-profit levels.
________________________________________
1. Why These Specific Indicators and Code Elements?
The "OptionHawk" script is a strategic fusion of the Supertrend indicator (modified with Keltner Channels), a multi-EMA "Energy" ribbon, dynamic trend lines (based on SMA and ATR), a 100-period Trend Filter EMA, and comprehensive trade management logic (SL/TP). My reason and motivation for this mashup stem from a desire to create a robust system that accounts for various market aspects often overlooked by individual indicators:
• Supertrend with Keltner Channels: The standard Supertrend is effective for trend identification but can sometimes generate whipsaws in volatile or ranging markets. By integrating Keltner Channels into the Supertrend calculation, the volatility measure becomes more adaptive, using the (high - low) range within the Keltner Channel for its ATR-like component. This aims to create a more responsive yet less prone-to-false-signals Supertrend.
• Multi-EMA "Energy" Ribbon: This visually striking element, composed of 15 EMAs, provides a quick glance at short-to-medium term momentum and potential support/resistance zones. When these EMAs are stacked and moving in one direction, it indicates strong "energy" behind the trend, reinforcing the signals from other indicators.
• Dynamic Trend Lines (SMA + ATR): These lines offer a visual representation of support and resistance that adapts to market volatility. Unlike static trend lines, their ATR-based offset ensures they remain relevant across different market conditions and asset classes, providing context for price action relative to the underlying trend.
• 100-Period Trend Filter EMA: A longer-period EMA acts as a higher-timeframe trend filter. This is crucial for confirming the direction identified by the faster-acting Supertrend, helping to avoid trades against the prevailing broader trend.
• Comprehensive Trade Management Logic: The script integrates automated calculation and display of stop-loss (SL) and multiple take-profit (TP) levels, along with trade confirmation and "TP Hit" labels. This is critical for practical trading, providing immediate, calculated risk-reward parameters that individual indicators typically don't offer.
This combination is driven by the need for a multi-faceted approach to trading that goes beyond simple signal generation to include trend confirmation, volatility adaptation, and essential risk management.
________________________________________
2. What Problem or Need Does This Mashup Solve?
This mashup addresses several critical gaps that existing individual indicators often fail to fill:
• Reliable Trend Identification in Volatile Markets: While Supertrend is good, it can be late or whipsaw. Integrating Keltner Channels helps it adapt to changing volatility, providing more reliable trend signals.
• Confirmation of Signals: A common pitfall of relying on a single indicator is false signals. "OptionHawk" uses the multi-EMA "Energy" ribbon and the 100-period EMA to confirm the trend identified by the Keltner-Supertrend, reducing false entries.
• Dynamic Support/Resistance & Trend Context: Static support and resistance levels can quickly become irrelevant. The dynamic SMA + ATR trend lines provide continually adjusting zones that reflect the current market's true support and resistance, giving traders a better understanding of price action within the trend.
• Integrated Risk and Reward Management: Most indicators just give entry signals. This script goes a significant step further by automatically calculating and displaying clear stop-loss and up to five take-profit levels (either ATR-based or percentage-based). This is a vital component for structured trading, allowing traders to pre-define their risk and reward for each trade.
• Visual Clarity and Actionable Information: Instead of requiring traders to layer multiple indicators manually, "OptionHawk" integrates them into a single, cohesive display with intuitive bar coloring, shape plots, and informative labels. This reduces cognitive load and presents actionable information directly on the chart.
In essence, "OptionHawk" provides a more comprehensive, adaptive, and actionable trading framework than relying on isolated indicators.
________________________________________
3. How Do the Components Work Together?
The various components of "OptionHawk" interact in a synergistic and often sequential manner to generate signals and manage trades:
• Keltner-Supertrend as the Primary Signal Generator: The supertrend function, enhanced by keltner_channel, is the core of the system. It identifies potential trend reversals and continuation signals (bullish/bearish crosses of the supertrendLine). The sensitivity and factor inputs directly influence how closely the Supertrend follows price and its responsiveness to volatility.
• Multi-EMA "Energy" Ribbon for Momentum and Confirmation: The 15 EMAs (from ema1 to ema15) are plotted to provide a visual representation of short-term momentum. When the price is above these EMAs and they are spread out and pointing upwards, it suggests strong bullish "energy." Conversely, when price is below them and they are pointing downwards, it indicates bearish "energy." This ribbon serves as a simultaneous visual confirmation for the Supertrend signals; a buy signal from Supertrend is stronger if the EMA ribbon is also indicating upward momentum.
• Dynamic Trend Lines for Context and Confirmation: The sma_high and sma_low lines, incorporating ATR, act as dynamic support and resistance. The trend variable, determined by price crossing these lines, provides an overarching directional bias. This component works conditionally with the Supertrend; a bullish Supertrend signal is more potent if the price is also above the sma_high (indicating an uptrend).
• 100-Period Trend Filter EMA for Macro Trend Confirmation: The ema100 acts as a macro trend filter. Supertrend signals are typically considered valid if they align with the direction of the ema100. For example, a "BUY" signal from the Keltner-Supertrend is ideally taken only if the price is also above the ema100, signifying that the smaller trend aligns with the larger trend. This is a conditional filter.
• Trade Confirmation and SL/TP Logic (Sequential and Conditional):
• Once a bull or bear signal is generated by the Keltner-Supertrend, the tradeSignalCall or tradeSignalPut is set to true.
• A confirmation step then occurs for a "BUY" signal, the script checks if the close of the next bar is higher than the entry bar's close. For a "SELL" signal, it checks if the close of the next bar is lower. This is a sequential confirmation step aimed at filtering out weak signals.
• Upon a confirmed signal, the stop-loss (SL) is immediately set based on the previous bar's low (for calls) or high (for puts).
• Multiple take-profit (TP) levels are calculated and stored in arrays. These can be based on a fixed percentage or dynamic ATR multiples, based on user input.
• The TP HIT logic continuously monitors price action simultaneously against these pre-defined target levels, displaying labels when a target is reached. The SL HIT logic similarly monitors for a stop-loss breach.
In summary, the Supertrend generates the initial signal, which is then confirmed by the dynamic trend lines and the 100-period EMA, and visually reinforced by the EMA "Energy" ribbon. The trade management logic then takes over, calculating and displaying vital risk-reward parameters.
________________________________________
4. What is the Purpose of the Mashup Beyond Simply Merging Code?
The purpose of "OptionHawk" extends far beyond merely combining different indicator codes; it's about creating a structured and informed decision-making process for options trading. The key strategic insights and functionalities added by combining these elements are:
• Enhanced Signal Reliability and Reduced Noise: By requiring multiple indicators to align (e.g., Keltner-Supertrend signal confirmed by EMA trend filter and dynamic trend lines), the script aims to filter out false signals and whipsaws that commonly plague individual indicators. This leads to higher-probability trade setups.
• Adaptive Risk Management: The integration of ATR into both the Supertrend calculation and the dynamic stop-loss/take-profit levels makes the entire system adaptive to current market volatility. This means stop-losses and targets are not static but expand or contract with the market's price swings, promoting more realistic risk management.
• Clear Trade Entry and Exit Framework: The script provides a complete trading plan with each signal: a clear entry point, a precise stop-loss, and multiple cascading take-profit levels. This holistic approach empowers traders to manage their trades effectively from initiation to conclusion, rather than just identifying a potential entry.
• Visual Confirmation of Market Strength: The "Energy" ribbon and dynamic trend lines provide an immediate visual understanding of the market's momentum and underlying trend strength, helping traders gauge conviction behind a signal.
• Improved Backtesting and Analysis: By combining these elements into one script, traders can more easily backtest a comprehensive strategy rather than trying to manually combine signals from multiple overlaying indicators, leading to more accurate strategy analysis.
• Suitability for Options Trading: Options contracts are highly sensitive to price movement and volatility. This script's focus on confirmed trend identification, dynamic volatility adaptation, and precise risk management makes it particularly well-suited for the nuanced demands of options trading, where timing and defined risk are paramount.
________________________________________
5. What New Functionality or Insight Does Your Script Offer?
"OptionHawk" offers several new functionalities and insights that significantly enhance decision-making, improve accuracy, and provide clearer signals and better timing for traders:
• "Smart" Supertrend: By basing the Supertrend's volatility component on the Keltner Channel's range instead of a simple ATR, the Supertrend becomes more sensitive to price action within its typical bounds while still adapting to broader market volatility. This can lead to earlier and more relevant trend change signals.
• Multi-Confirmation System: The script doesn't just provide a signal; it layers multiple confirmations (Keltner-Supertrend, multi-EMA "Energy" coloration, dynamic trend lines, and the 100-period EMA). This multi-layered validation significantly improves the accuracy of signals by reducing the likelihood of false positives.
• Automated and Dynamic Risk-Reward Display: This is a major functionality enhancement. The automatic calculation and clear display of stop-loss and five distinct take-profit levels (based on either ATR or percentage) directly on the chart, along with "TP HIT" and "SL HIT" labels, streamline the trading process. Traders no longer need to manually calculate these crucial levels, leading to enhanced decision-making and better risk management.
• Visual Trend "Energy" and Momentum: The vibrant coloring of the multi-EMA ribbon based on price relative to the EMA provides an intuitive and immediate visual cue for market momentum and "energy." This offers an insight into the strength of the current move, which isn't available from single EMA plots.
• Post-Signal Confirmation: The "Confirmation" label appearing on the bar after a signal, if the price continues in the signaled direction, adds an extra layer of real-time validation. This helps to improve signal timing by waiting for initial follow-through.
• Streamlined Options Trading Planning: For options traders, having clear entry prices, stop-losses, and multiple target levels directly annotated on the chart is invaluable. It helps in quickly assessing potential premium movements and managing positions effectively.
In essence, "OptionHawk" transitions from a collection of indicators to a semi-automated trading assistant, providing a comprehensive, visually rich, and dynamically adaptive framework for making more informed and disciplined trading decisions.
----------------------------------------------------------------------------------------------------------------
Performance & Claims
1. What is the claimed performance of the script or strategy?
Answer: The script does not claim any specific performance metrics (e.g., win rate, profit factor, percentage gains). It's an indicator designed to identify potential buy/sell signals and target/stop-loss levels. The labels it generates ("BUY CALL," "BUY PUT," "TP HIT," "SL HIT") are informational based on its internal logic, not a representation of actual trading outcomes.
2. Is there any proof or backtesting to support this claim?
Answer: No, the provided code does not include any backtesting functionality or historical performance proof. As an indicator, it simply overlays visual signals on the chart. To obtain backtesting results, the logic would need to be implemented as a Pine Script strategy with entry/exit rules and commission/slippage considerations.
3. Are there any unrealistic or exaggerated performance expectations being made?
Answer: The script itself does not make any performance expectations. It avoids quantitative claims. However, if this script were presented to users with implied promises of profit based solely on the visual signals, that would be unrealistic.
4. Have you clearly stated the limitations of the performance data (e.g., “based on backtesting only”)?
Answer: There is no statement of performance data or its limitations because the script doesn't generate performance data.
5. Do you include a disclaimer that past results do not guarantee future performance?
Answer: No, the script does not include any disclaimers about past or future performance. This is typically found in accompanying documentation or marketing materials for a trading system, not within the indicator's code itself.
________________________________________
Evidence & Transparency
6. How are your performance results measured (e.g., profit factor, win rate, Sharpe ratio)?
Answer: Performance results are not measured by this script. It's an indicator.
7. Are these results reproducible by others using the same script and settings?
Answer: The visual signals and calculated levels (Supertrend line, EMAs, target/SL levels) generated by the script are reproducible on TradingView when applied to the same instrument, timeframe, and with the same input settings. However, the actual trading results (profit/loss) are not generated or reproducible by this indicator.
8. Do you include enough data (charts, equity curves, trade logs) to support your claims?
Answer: No, the script does not include or generate equity curves or trade logs. It provides visual labels on the chart, which can be seen as a form of "data" to support the signal generation, but not the performance claims (as none are made by the code).
________________________________________
Future Expectations
9. Are you making any predictions about future market performance?
Answer: No, the script does not make any explicit predictions about future market performance. Its signals are based on historical price action and indicator calculations.
10. Have you stated clearly that the future is fundamentally uncertain?
Answer: No, the script does not contain any statements about the uncertainty of the future.
11. Are forward-looking statements presented with caution and appropriate language?
Answer: The script does not contain any forward-looking statements beyond the visual signals it generates based on real-time data.
________________________________________
Risk & Disclosure
12. Have you disclosed the risks associated with using your script or strategy?
Answer: No, the script does not include any risk disclosures. This is typically found in external documentation.
13. Do you explain that trading involves potential loss as well as gain?
Answer: No, the script does not contain any explanation about the potential for loss in trading.
________________________________________
Honesty & Integrity
14. Have you avoided hype words like “guaranteed,” “foolproof,” or “no losses”?
Answer: Yes, the script itself avoids these hype words. The language used within the code is technical and describes the indicator's logic.
15. Is your language grounded and realistic rather than promotional?
Answer: Yes, the language within the provided Pine Script code is grounded and realistic as it pertains to the technical implementation of an indicator.
16. Are you leaving out any important details that might mislead users (e.g., selective performance snapshots)?
Answer: From the perspective of the code itself, no, it's not "leaving out" performance details because it's not designed to generate them. However, if this indicator were to be presented as a "strategy" that implies profitability without accompanying disclaimers, backtesting results, and risk disclosures, then that external presentation could be misleading. The script focuses on signal generation and visual representation.
⚠️ Disclaimer:
This indicator is for informational and educational purposes only. It does not guarantee any future results or performance. All trading involves risk. Please assess your own risk tolerance and consult a licensed financial advisor if needed. Past performance does not indicate future returns.
In den Scripts nach "stop loss" suchen

Profit Guard ProProfitGuard Pro
ProfitGuard Pro is a risk management and profit calculation tool that helps traders optimize their trades by handling position sizing, risk management, leverage, and take profit calculations. With support for both cumulative and non-cumulative take profit strategies, this versatile indicator provides the insights you need to maximize your trading strategy.
How to Use ProfitGuard Pro:
Load the Indicator: Add ProfitGuard Pro to your chart in TradingView.
Set Your Entry Position: Input your desired entry price.
Define Your Stop Loss: Enter the price at which your trade will exit to minimize losses.
Add Take Profit Levels: Input your TP1, TP2, TP3, and TP4 levels, as needed.
If you want fewer take profit levels, adjust the number of TPs in the settings menu. You can choose between 1 to 4 take profit levels based on your strategy.
Adjust Risk Settings: Specify your account size and risk percentage to calculate position size and leverage.
Choose Cumulative or Non-Cumulative Mode: Toggle cumulative profit mode to either recalculate position sizes as each take profit is hit or keep position sizes static for each TP.
Once set up, ProfitGuard Pro will automatically calculate your position size, leverage, and potential profits for each take profit level, providing a clear visual on your chart to guide your trading decisions.
Key Features:
Risk Management:
Calculate your risk percentage based on account size and stop loss.
Visualize risk in dollar terms and percentage of your account.
Position Size & Leverage:
Automatically calculate the ideal position size and leverage for your trade based on your entry, stop loss, and risk settings.
Ensure you are trading with the appropriate leverage for your account size.
Cumulative vs Non-Cumulative Profit Mode:
Cumulative Mode: Adjusts position size after each take profit is reached, recalculating for remaining contracts.
Non-Cumulative Mode: Treats each take profit as a separate calculation using the full position size.
Take Profit Levels:
Set up to 4 customizable take profit levels.
Adjust percentage values for each TP target, and visualize them on your chart with easy-to-read lines.
Profit Calculation:
Displays potential profits for each take profit level based on whether cumulative or non-cumulative mode is selected.
Calculate your risk-reward ratio dynamically at each TP.
Customizable Visuals:
Easily customize the table's size, position, and color scheme to fit your chart.
Visualize key trade details like leverage, contracts, margin, and profits directly on your chart.
Short and Long Position Support:
Automatically adjusts calculations based on whether you're trading long or short.

FVG Visual Trading ToolHow to Use the FVG Tool
1. Identify the FVG Zone
Bullish FVG: Look for green boxes that represent potential support zones. These are areas where price is likely to retrace before continuing upward.
Bearish FVG: Look for red boxes that represent potential resistance zones. These are areas where price is likely to retrace before continuing downward.
2. Set Up Your Trade
Entry: Place a limit order at the retracement zone (inside the FVG box). This ensures you enter the trade when the price retraces into the imbalance.
Stop-Loss (SL): Place your stop-loss just below the FVG box for bullish trades or just above the FVG box for bearish trades. The tool provides a suggested SL level.
Take-Profit (TP): Set your take-profit level at a 2:1 risk-reward ratio (or higher). The tool provides a suggested target level.
3. Let the Trade Run
Once your trade is set up, let it play out. Avoid micromanaging the trade unless market conditions change drastically.
Step-by-Step Example
Bullish FVG Trade
Identify the FVG:
A green box appears, indicating a bullish FVG.
The tool provides the target price (e.g., 0.6371) and the stop-loss level (e.g., 0.6339).
Set Up the Trade:
Place a limit buy order at the retracement zone (inside the green box).
Set your stop-loss just below the FVG box (e.g., 0.6339).
Set your take-profit at a 2:1 risk-reward ratio or the suggested target (e.g., 0.6371).
Monitor the Trade:
Wait for the price to retrace into the FVG zone and trigger your limit order.
Let the trade run until it hits the take-profit or stop-loss.
Bearish FVG Trade
Identify the FVG:
A red box appears, indicating a bearish FVG.
The tool provides the target price and the stop-loss level.
Set Up the Trade:
Place a limit sell order at the retracement zone (inside the red box).
Set your stop-loss just above the FVG box.
Set your take-profit at a 2:1 risk-reward ratio or the suggested target.
Monitor the Trade:
Wait for the price to retrace into the FVG zone and trigger your limit order.
Let the trade run until it hits the take-profit or stop-loss.
Key Features of the Tool in Action
Visual Clarity:
The green and red boxes clearly show the FVG zones, making it easy to identify potential trade setups.
Labels provide the target price and stop-loss level for quick decision-making.
Risk-Reward Management:
The tool encourages disciplined trading by providing predefined SL and TP levels.
A 2:1 risk-reward ratio ensures that profitable trades outweigh losses.
Hands-Off Execution:
By placing limit orders, you can let the trade execute automatically without needing to monitor the market constantly.
Best Practices
Trade in the Direction of the Trend:
Use higher timeframes (e.g., 4-hour or daily) to identify the overall trend.
Focus on bullish FVGs in an uptrend and bearish FVGs in a downtrend.
Combine with Confirmation Signals:
Look for additional confirmation, such as candlestick patterns (e.g., engulfing candles) or indicator signals (e.g., RSI, MACD).
Adjust Parameters for Volatility:
For highly volatile markets, consider increasing the stop-loss percentage to avoid being stopped out prematurely.
Avoid Overtrading:
Not every FVG is a good trading opportunity. Be selective and only trade setups that align with your strategy.
Backtest and Optimize:
Use historical data to test the tool and refine your approach before trading live.
Common Mistakes to Avoid
Entering Without Confirmation:
Wait for price to retrace into the FVG zone before entering a trade.
Avoid chasing trades that have already moved away from the zone.
Ignoring Risk Management:
Always use a stop-loss to protect your account.
Stick to a consistent risk-reward ratio.
Trading Against the Trend:
Avoid taking trades that go against the prevailing market trend unless there is strong evidence of a reversal.
Final Thoughts
The FVG Visual Trading Tool is a powerful aid for identifying high-probability trade setups. By following the steps outlined above, you can use the tool to trade with confidence and discipline. Remember, no tool guarantees success, so always combine it with sound trading principles and proper risk management

Pivot Points [SMRT Algo]Pivot Points is a free, innovative indicator designed to automatically detect and highlight key turning points on your TradingView charts through advanced candlestick pattern analysis. This indicator is perfect for traders seeking clear visual signals for potential trend reversals.
How It Works:
Candlestick Pattern Analysis: The indicator continuously scans for specific candlestick formations. It identifies a potential high pivot when a bullish candle (where the close is higher than the open) is immediately followed by a bearish candle (where the close is lower than the open). Conversely, a potential low pivot is detected when a bearish candle is followed by a bullish candle.
Boxing the Price Range: Once a potential pivot is identified, the algorithm draws a box around the corresponding price range. This box captures the area where the price action is concentrated, serving as a zone of interest for the pivot.
Confirmation of Major Pivots: The initial detection marks what we call a "minor pivot" with a temporary yellow box. The indicator then waits for subsequent price action. If the price fails to break out of this box—meaning it remains confined within the defined boundaries—the pivot is confirmed as a major pivot. At this stage, the yellow box changes color to green (or red, depending on whether it’s a high or low pivot), clearly marking the confirmed turning point.
Pivot Sequence: The progression follows a clear sequence: Minor Pivot ➔ Yellow Box ➔ Major Pivot. This step-by-step visual guide helps traders quickly interpret the strength and significance of the pivot.
Inputs:
Show Labels: An input option allows you to toggle pivot labels on or off, so you can choose whether to display descriptive labels directly on your chart.
Adjustable Colors: The colors of the pivot points—including the green and red boxes—are fully customizable via the input settings. This ensures that you can tailor the visual appearance of the indicator to match your personal charting style or trading strategy.
Enhancing Entry and Exit Strategies
Entry Points: Look to enter a trade when the indicator confirms a pivot (after the box changes color). A confirmed pivot could indicate that a reversal is underway, giving you a potential entry signal.
Exit Points & Stop Losses: Use the boundaries of the pivot box to set stop losses. For example, if you’re in a long trade and the price approaches a confirmed resistance pivot, consider this a signal to tighten stops or exit, as the trend may reverse.
Confluence with Other Indicators: Combine the pivot point signals with other tools like RSI, MACD, or volume indicators. If multiple signals point to a reversal at the same pivot, it strengthens your confidence in the trade decision.
Trading Strategy Applications
Reversal Trading: Use confirmed pivot points as indicators for potential reversals. Enter trades when the price action validates the pivot point, anticipating that the market is turning.
Range Trading: When the price oscillates within a defined pivot box, you can use the top and bottom of the box as potential boundaries for a range-trading strategy.
Breakout Trading: Conversely, if the price breaks out of a pivot box, this may signal the start of a new trend. You can use this breakout as a trigger for entering a position in the direction of the breakout.
The indicator highlights potential reversal zones with clearly marked boxes and labels, making it easier to spot key turning points and manage trades effectively.
Pivot Points removes the guesswork by automatically scanning for and confirming pivot points based on rigorous candlestick analysis.
Whether you're a day trader or a swing trader, Pivot Points provides actionable insights into market dynamics, helping you to better time entries and exits.

ChartArt-Bankniftybuying5minName: ChartArt-BankNifty Buying Strategy (5-Minute)
Timeframe: 5-Minute Candles
Asset: BankNifty (Indian Stock Market Index)
Trading Hours: 9:30 AM - 2:45 PM IST (Indian Standard Time)
This strategy is designed for BankNifty intraday traders who want to capitalize on short-term price movements within a defined trading window. It combines technical indicators like Simple Moving Averages (SMA), Relative Strength Index (RSI), and candlestick patterns to identify potential buy signals during intraday downtrends. The strategy employs specific entry, stop-loss, and target conditions to manage trades effectively and minimize risk.
Technical Indicators Used
Simple Moving Averages (SMA):
EMA7: 7-period SMA on closing price.
EMA5: 5-period SMA on closing price.
Purpose: Used to identify the intraday trend by comparing short-term moving averages. The strategy focuses on situations where the market is in a minor downtrend, indicated by EMA5 being below EMA7.
Relative Strength Index (RSI):
RSI14: 14-period RSI, a momentum oscillator that measures the speed and change of price movements.
SMA14: 14-period SMA of the RSI.
Purpose: RSI is used to identify potential reversal points. The strategy looks for situations where the RSI is below its own moving average, suggesting weakening momentum in the downtrend.
Candlestick Patterns:
Relaxed Hammer or Doji (2nd Candle): A pattern where the second candle in a 3-candle sequence shows a potential reversal signal (Hammer or Doji), indicating indecision or a potential turning point.
Bearish 1st Candle: The first candle is bearish, setting up the context for a potential reversal.
Bullish 3rd Candle: The third candle must be bullish with specific characteristics (closing near the high, surpassing the previous high), confirming the reversal.
Strategy Conditions
Time Condition:
The strategy is only active during specific hours (9:30 AM to 2:45 PM IST). This ensures that trades are only taken during the most liquid hours of the trading day, avoiding potential volatility or lack of liquidity towards market close.
Intraday Downtrend Condition:
EMA5 < EMA7: Indicates that the market is in a minor downtrend. The strategy looks for reversal opportunities within this trend.
RSI Condition:
RSI14 <= SMA14: Indicates that the current RSI value is below its 14-period SMA, suggesting potential weakening momentum, which can precede a reversal.
Candlestick Patterns:
1st Candle: Must be bearish, setting up the context for a potential reversal.
2nd Candle: Must either be a Hammer or Doji, indicating a potential reversal pattern.
3rd Candle: Must be bullish, with specific characteristics (closing near the high, breaking the previous high, etc.), confirming the reversal.
RSI Crossover Condition:
A crossover of the RSI over its SMA in the last 5 periods is also checked, adding further confirmation to the reversal signal.
Entry and Exit Rules
Entry Signal:
A buy signal is generated when all the conditions (time, intraday downtrend, bearish 1st candle, hammer/doji 2nd candle, bullish 3rd candle, and RSI condition) are met. The trade is entered at the high of the bullish third candle.
Stop Loss:
The stop loss is calculated based on the difference between the entry price and the low of the second candle. If this difference is greater than 90 points, the stop loss is placed at the midpoint of the second candle's range (average of high and low). Otherwise, it is placed at the low of the second candle.
Target 1:
The first target is set at 1.8 times the difference between the entry price and the stop loss. When this target is hit, half of the position is exited to lock in partial profits.
Target 2:
The second target is set at 3 times the difference between the entry price and the stop loss. The remaining position is exited at this point, or if the price hits the stop loss.
Originality and Usefulness
This strategy is original in its combination of multiple technical indicators and candlestick patterns to identify potential reversals in a specific intraday timeframe. By focusing on minor downtrends and utilizing a 3-candle reversal pattern, the strategy seeks to capture quick price movements with a structured approach to risk management.
Key Benefits:
High Precision: The strategy’s multi-step filtering process (time condition, trend confirmation, candlestick pattern analysis, and momentum evaluation via RSI) increases the likelihood of accurate trade signals.
Risk Management: The use of a dynamic stop-loss based on candle characteristics, combined with partial profit-taking, allows traders to lock in profits while still giving the trade room to develop further.
Structured Approach: The strategy provides a clear, rule-based system for entering and exiting trades, which can help remove emotional decision-making from the trading process.
Charts and Signals
The strategy produces signals in the form of labels on the chart:
Buy Signal: A green label is plotted below the candle that meets all entry conditions, indicating a potential buy opportunity.
Stop Loss (SL): A red dashed line is drawn at the stop-loss level with a label indicating "SL".
Target 1 (1st TG): A blue dashed line is drawn at the first target level with a label indicating "1st TG".
Target 2 (2nd TG): Another blue dashed line is drawn at the second target level with a label indicating "2nd TG".
These visual aids help traders quickly identify entry points, stop loss levels, and target levels on the chart, making the strategy easy to follow and implement.
Backtesting and Optimization
Backtesting: The strategy can be backtested on TradingView using historical data to evaluate its performance. Traders should consider testing across different market conditions to ensure the strategy's robustness.
Optimization: Parameters such as the RSI period, moving averages, and target multipliers can be optimized based on backtesting results to refine the strategy further.
Conclusion
The ChartArt-BankNifty Buying Strategy offers a well-rounded approach to intraday trading, focusing on capturing reversals in minor downtrends. With a strong emphasis on technical analysis, precise entry and exit rules, and robust risk management, this strategy provides a solid framework for traders looking to engage in intraday trading on BankNifty.

Average SL% Calculator with TP Levels by GorkiAverage Stop Loss And Take Profit Calculator For Futures Trading by Gorki
Description
The "Average SL% Calculator with TP Levels" script, is a simple tool for traders to plan the trades and check how much loss they are going to receive if they run this strategy. This script calculates the average price of up to four entry points, determines the percentage distance to the stop-loss level, and provides potential loss information based on margin and leverage. Additionally, it includes multiple take-profit levels to help traders systematically capture profits. Visual elements such as horizontal lines and labels make it easy to monitor key levels directly on the chart.
Why To Use This Indicator?
Risk Management: Automatically calculates the percentage distance to the stop-loss level, helping you to understand potential losses.
Profit Optimization: Supports up to four take-profit levels, enabling a structured approach to capturing gains.
Visual Clarity: Displays key levels and important information directly on the chart for easy monitoring.
Alerts: Generates alerts when the price crosses specified levels, ensuring you never miss critical trading signals.
How to Use the Script
Add the Script to Your Chart: Apply the script to your TradingView chart.
Set Input Values: Entry Points: Define up to four limit prices (LIMIT 1, LIMIT 2, LIMIT 3, LIMIT 4).
Stop-Loss: Set your stop-loss price (STOP LOSS).
Take Profits: Specify up to four take-profit levels (Take Profit 1, Take Profit 2, Take Profit 3, Take Profit 4).
Leverage: Input your leverage factor.
Margin: Enter the total margin amount for the trade.
View Calculations: The script will calculate the average entry price, the percentage distance to the stop-loss, and the potential loss based on margin and leverage.
Monitor Levels: Horizontal lines and labels will appear on the chart, showing entry points, stop-loss, and take-profit levels.
Set Alerts: Alerts will trigger when the price crosses your defined levels, helping you to take timely action.
Calculation Details
Average Price: Calculated as the mean of the specified limit prices.
Distance to Stop-Loss: Determined as the percentage difference between the average price and the stop-loss level.
Leveraged Distance: The stop-loss distance percentage multiplied by the leverage factor.
Potential Loss: Calculated by applying the leveraged distance percentage to the margin amount.
Take Profit Percentages: The percentage difference between the average price and each take-profit level.
This comprehensive indicator is a must-have for any trader looking to manage risks effectively while maximizing potential profits. Happy trading!

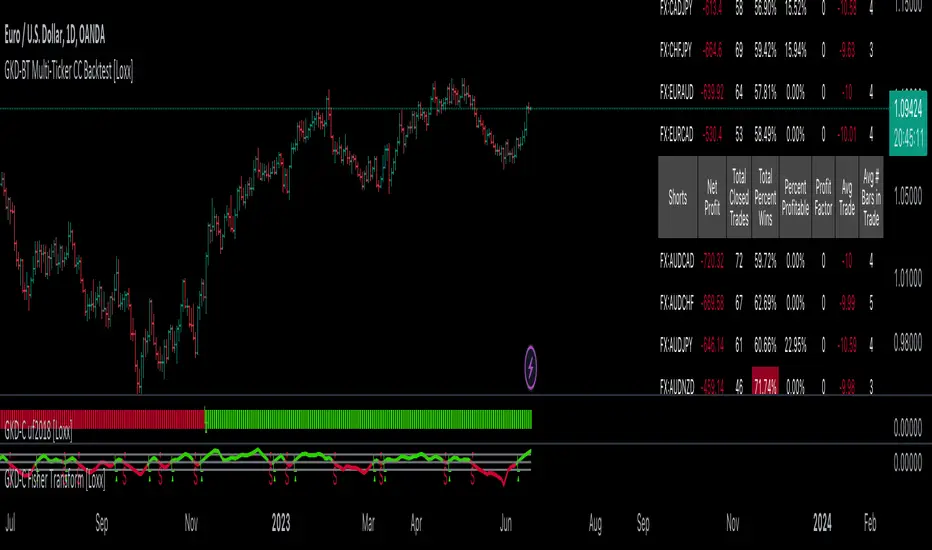
GKD-BT Multi-Ticker CC Backtest [Loxx]The Giga Kaleidoscope GKD-BT Multi-Ticker CC Backtest is a backtest module included in Loxx's "Giga Kaleidoscope Modularized Trading System."
█ Giga Kaleidoscope GKD-BT Multi-Ticker CC Backtest
This backtest allows you to test GKD-C Confirmation 1 and GKD-C Confirmation 2 indicators together without the hassle of adding additional confluence indicators. The backtest includes 1 take profit and 1 SL and various types of volatility. The backtest results on the chart are using 10% equity of 1 million total equity and $5 commission per trade.
To use this indicator:
1. Import the value "Input into NEW GKD-BT Backtest" from the GKD-C Confirmation 1 indicator into the GKD-BT Multi-Ticker CC Backtest.
2. Import the value "Input into NEW GKD-BT Backtest" from the GKD-C Confirmation 2 indicator into the GKD-BT Multi-Ticker CC Backtest.
This backtest includes the following metrics:
1. Net profit: Overall profit or loss achieved.
2. Total Closed Trades: Total number of closed trades, both winning and losing.
3. Total Percent Wins: Total wins, whether long or short, for the selected time interval regardless of commissions and other profit-modifying addons.
4. Percent Profitable: Total wins, whether long or short, that are also profitable, taking commissions into account.
5. Profit Factor: The ratio of gross profits to gross losses, indicating how much money the strategy made for every unit of money it lost.
6. Average Profit per Trade: The average gain or loss per trade, calculated by dividing the net profit by the total number of closed trades.
7. Average Number of Bars in Trade: The average number of bars that elapsed during trades for all closed trades.
Summary of notable settings:
Input Tickers separated by commas: Allows the user to input tickers separated by commas, specifying the symbols or tickers of financial instruments used in the backtest. The tickers should follow the format "EXCHANGE:TICKER" (e.g., "NASDAQ:AAPL, NYSE:MSFT").
Import GKD-B Baseline: Imports the "GKD-B Baseline" indicator.
Import GKD-V Volatility/Volume: Imports the "GKD-V Volatility/Volume" indicator.
Import GKD-C Confirmation: Imports the "GKD-C Confirmation" indicator.
Import GKD-C Continuation: Imports the "GKD-C Continuation" indicator.
Initial Capital: Represents the starting account balance for the backtest, denominated in the base currency of the trading account.
Order Size: Determines the quantity of contracts traded in each trade.
Order Type: Specifies the type of order used in the backtest, either "Contracts" or "% Equity."
Commission: Represents the commission per order or transaction cost incurred in each trade.
█ Giga Kaleidoscope Modularized Trading System
Core components of an NNFX algorithmic trading strategy
The NNFX algorithm is built on the principles of trend, momentum, and volatility. There are six core components in the NNFX trading algorithm:
1. Volatility - price volatility; e.g., Average True Range, True Range Double, Close-to-Close, etc.
2. Baseline - a moving average to identify price trend
3. Confirmation 1 - a technical indicator used to identify trends
4. Confirmation 2 - a technical indicator used to identify trends
5. Continuation - a technical indicator used to identify trends
6. Volatility/Volume - a technical indicator used to identify volatility/volume breakouts/breakdown
7. Exit - a technical indicator used to determine when a trend is exhausted
8. Metamorphosis - a technical indicator that produces a compound signal from the combination of other GKD indicators*
*(not part of the NNFX algorithm)
What is Volatility in the NNFX trading system?
In the NNFX (No Nonsense Forex) trading system, ATR (Average True Range) is typically used to measure the volatility of an asset. It is used as a part of the system to help determine the appropriate stop loss and take profit levels for a trade. ATR is calculated by taking the average of the true range values over a specified period.
True range is calculated as the maximum of the following values:
-Current high minus the current low
-Absolute value of the current high minus the previous close
-Absolute value of the current low minus the previous close
ATR is a dynamic indicator that changes with changes in volatility. As volatility increases, the value of ATR increases, and as volatility decreases, the value of ATR decreases. By using ATR in NNFX system, traders can adjust their stop loss and take profit levels according to the volatility of the asset being traded. This helps to ensure that the trade is given enough room to move, while also minimizing potential losses.
Other types of volatility include True Range Double (TRD), Close-to-Close, and Garman-Klass
What is a Baseline indicator?
The baseline is essentially a moving average, and is used to determine the overall direction of the market.
The baseline in the NNFX system is used to filter out trades that are not in line with the long-term trend of the market. The baseline is plotted on the chart along with other indicators, such as the Moving Average (MA), the Relative Strength Index (RSI), and the Average True Range (ATR).
Trades are only taken when the price is in the same direction as the baseline. For example, if the baseline is sloping upwards, only long trades are taken, and if the baseline is sloping downwards, only short trades are taken. This approach helps to ensure that trades are in line with the overall trend of the market, and reduces the risk of entering trades that are likely to fail.
By using a baseline in the NNFX system, traders can have a clear reference point for determining the overall trend of the market, and can make more informed trading decisions. The baseline helps to filter out noise and false signals, and ensures that trades are taken in the direction of the long-term trend.
What is a Confirmation indicator?
Confirmation indicators are technical indicators that are used to confirm the signals generated by primary indicators. Primary indicators are the core indicators used in the NNFX system, such as the Average True Range (ATR), the Moving Average (MA), and the Relative Strength Index (RSI).
The purpose of the confirmation indicators is to reduce false signals and improve the accuracy of the trading system. They are designed to confirm the signals generated by the primary indicators by providing additional information about the strength and direction of the trend.
Some examples of confirmation indicators that may be used in the NNFX system include the Bollinger Bands, the MACD (Moving Average Convergence Divergence), and the MACD Oscillator. These indicators can provide information about the volatility, momentum, and trend strength of the market, and can be used to confirm the signals generated by the primary indicators.
In the NNFX system, confirmation indicators are used in combination with primary indicators and other filters to create a trading system that is robust and reliable. By using multiple indicators to confirm trading signals, the system aims to reduce the risk of false signals and improve the overall profitability of the trades.
What is a Continuation indicator?
In the NNFX (No Nonsense Forex) trading system, a continuation indicator is a technical indicator that is used to confirm a current trend and predict that the trend is likely to continue in the same direction. A continuation indicator is typically used in conjunction with other indicators in the system, such as a baseline indicator, to provide a comprehensive trading strategy.
What is a Volatility/Volume indicator?
Volume indicators, such as the On Balance Volume (OBV), the Chaikin Money Flow (CMF), or the Volume Price Trend (VPT), are used to measure the amount of buying and selling activity in a market. They are based on the trading volume of the market, and can provide information about the strength of the trend. In the NNFX system, volume indicators are used to confirm trading signals generated by the Moving Average and the Relative Strength Index. Volatility indicators include Average Direction Index, Waddah Attar, and Volatility Ratio. In the NNFX trading system, volatility is a proxy for volume and vice versa.
By using volume indicators as confirmation tools, the NNFX trading system aims to reduce the risk of false signals and improve the overall profitability of trades. These indicators can provide additional information about the market that is not captured by the primary indicators, and can help traders to make more informed trading decisions. In addition, volume indicators can be used to identify potential changes in market trends and to confirm the strength of price movements.
What is an Exit indicator?
The exit indicator is used in conjunction with other indicators in the system, such as the Moving Average (MA), the Relative Strength Index (RSI), and the Average True Range (ATR), to provide a comprehensive trading strategy.
The exit indicator in the NNFX system can be any technical indicator that is deemed effective at identifying optimal exit points. Examples of exit indicators that are commonly used include the Parabolic SAR, the Average Directional Index (ADX), and the Chandelier Exit.
The purpose of the exit indicator is to identify when a trend is likely to reverse or when the market conditions have changed, signaling the need to exit a trade. By using an exit indicator, traders can manage their risk and prevent significant losses.
In the NNFX system, the exit indicator is used in conjunction with a stop loss and a take profit order to maximize profits and minimize losses. The stop loss order is used to limit the amount of loss that can be incurred if the trade goes against the trader, while the take profit order is used to lock in profits when the trade is moving in the trader's favor.
Overall, the use of an exit indicator in the NNFX trading system is an important component of a comprehensive trading strategy. It allows traders to manage their risk effectively and improve the profitability of their trades by exiting at the right time.
What is an Metamorphosis indicator?
The concept of a metamorphosis indicator involves the integration of two or more GKD indicators to generate a compound signal. This is achieved by evaluating the accuracy of each indicator and selecting the signal from the indicator with the highest accuracy. As an illustration, let's consider a scenario where we calculate the accuracy of 10 indicators and choose the signal from the indicator that demonstrates the highest accuracy.
The resulting output from the metamorphosis indicator can then be utilized in a GKD-BT backtest by occupying a slot that aligns with the purpose of the metamorphosis indicator. The slot can be a GKD-B, GKD-C, or GKD-E slot, depending on the specific requirements and objectives of the indicator. This allows for seamless integration and utilization of the compound signal within the GKD-BT framework.
How does Loxx's GKD (Giga Kaleidoscope Modularized Trading System) implement the NNFX algorithm outlined above?
Loxx's GKD v2.0 system has five types of modules (indicators/strategies). These modules are:
1. GKD-BT - Backtesting module (Volatility, Number 1 in the NNFX algorithm)
2. GKD-B - Baseline module (Baseline and Volatility/Volume, Numbers 1 and 2 in the NNFX algorithm)
3. GKD-C - Confirmation 1/2 and Continuation module (Confirmation 1/2 and Continuation, Numbers 3, 4, and 5 in the NNFX algorithm)
4. GKD-V - Volatility/Volume module (Confirmation 1/2, Number 6 in the NNFX algorithm)
5. GKD-E - Exit module (Exit, Number 7 in the NNFX algorithm)
6. GKD-M - Metamorphosis module (Metamorphosis, Number 8 in the NNFX algorithm, but not part of the NNFX algorithm)
(additional module types will added in future releases)
Each module interacts with every module by passing data to A backtest module wherein the various components of the GKD system are combined to create a trading signal.
That is, the Baseline indicator passes its data to Volatility/Volume. The Volatility/Volume indicator passes its values to the Confirmation 1 indicator. The Confirmation 1 indicator passes its values to the Confirmation 2 indicator. The Confirmation 2 indicator passes its values to the Continuation indicator. The Continuation indicator passes its values to the Exit indicator, and finally, the Exit indicator passes its values to the Backtest strategy.
This chaining of indicators requires that each module conform to Loxx's GKD protocol, therefore allowing for the testing of every possible combination of technical indicators that make up the six components of the NNFX algorithm.
What does the application of the GKD trading system look like?
Example trading system:
Backtest: Multi-Ticker CC Backtest as shown on the chart above
Baseline: Hull Moving Average
Volatility/Volume: Hurst Exponent
Confirmation 1: Fisher Transform as shown on the chart above
Confirmation 2: uf2018 as shown on the chart above
Continuation: Coppock Curve
Exit: Rex Oscillator
Metamorphosis: Baseline Optimizer
Each GKD indicator is denoted with a module identifier of either: GKD-BT, GKD-B, GKD-C, GKD-V, GKD-M, or GKD-E. This allows traders to understand to which module each indicator belongs and where each indicator fits into the GKD system.
█ Giga Kaleidoscope Modularized Trading System Signals
Standard Entry
1. GKD-C Confirmation gives signal
2. Baseline agrees
3. Price inside Goldie Locks Zone Minimum
4. Price inside Goldie Locks Zone Maximum
5. Confirmation 2 agrees
6. Volatility/Volume agrees
1-Candle Standard Entry
1a. GKD-C Confirmation gives signal
2a. Baseline agrees
3a. Price inside Goldie Locks Zone Minimum
4a. Price inside Goldie Locks Zone Maximum
Next Candle
1b. Price retraced
2b. Baseline agrees
3b. Confirmation 1 agrees
4b. Confirmation 2 agrees
5b. Volatility/Volume agrees
Baseline Entry
1. GKD-B Baseline gives signal
2. Confirmation 1 agrees
3. Price inside Goldie Locks Zone Minimum
4. Price inside Goldie Locks Zone Maximum
5. Confirmation 2 agrees
6. Volatility/Volume agrees
7. Confirmation 1 signal was less than 'Maximum Allowable PSBC Bars Back' prior
1-Candle Baseline Entry
1a. GKD-B Baseline gives signal
2a. Confirmation 1 agrees
3a. Price inside Goldie Locks Zone Minimum
4a. Price inside Goldie Locks Zone Maximum
5a. Confirmation 1 signal was less than 'Maximum Allowable PSBC Bars Back' prior
Next Candle
1b. Price retraced
2b. Baseline agrees
3b. Confirmation 1 agrees
4b. Confirmation 2 agrees
5b. Volatility/Volume agrees
Volatility/Volume Entry
1. GKD-V Volatility/Volume gives signal
2. Confirmation 1 agrees
3. Price inside Goldie Locks Zone Minimum
4. Price inside Goldie Locks Zone Maximum
5. Confirmation 2 agrees
6. Baseline agrees
7. Confirmation 1 signal was less than 7 candles prior
1-Candle Volatility/Volume Entry
1a. GKD-V Volatility/Volume gives signal
2a. Confirmation 1 agrees
3a. Price inside Goldie Locks Zone Minimum
4a. Price inside Goldie Locks Zone Maximum
5a. Confirmation 1 signal was less than 'Maximum Allowable PSVVC Bars Back' prior
Next Candle
1b. Price retraced
2b. Volatility/Volume agrees
3b. Confirmation 1 agrees
4b. Confirmation 2 agrees
5b. Baseline agrees
Confirmation 2 Entry
1. GKD-C Confirmation 2 gives signal
2. Confirmation 1 agrees
3. Price inside Goldie Locks Zone Minimum
4. Price inside Goldie Locks Zone Maximum
5. Volatility/Volume agrees
6. Baseline agrees
7. Confirmation 1 signal was less than 7 candles prior
1-Candle Confirmation 2 Entry
1a. GKD-C Confirmation 2 gives signal
2a. Confirmation 1 agrees
3a. Price inside Goldie Locks Zone Minimum
4a. Price inside Goldie Locks Zone Maximum
5a. Confirmation 1 signal was less than 'Maximum Allowable PSC2C Bars Back' prior
Next Candle
1b. Price retraced
2b. Confirmation 2 agrees
3b. Confirmation 1 agrees
4b. Volatility/Volume agrees
5b. Baseline agrees
PullBack Entry
1a. GKD-B Baseline gives signal
2a. Confirmation 1 agrees
3a. Price is beyond 1.0x Volatility of Baseline
Next Candle
1b. Price inside Goldie Locks Zone Minimum
2b. Price inside Goldie Locks Zone Maximum
3b. Confirmation 1 agrees
4b. Confirmation 2 agrees
5b. Volatility/Volume agrees
Continuation Entry
1. Standard Entry, 1-Candle Standard Entry, Baseline Entry, 1-Candle Baseline Entry, Volatility/Volume Entry, 1-Candle Volatility/Volume Entry, Confirmation 2 Entry, 1-Candle Confirmation 2 Entry, or Pullback entry triggered previously
2. Baseline hasn't crossed since entry signal trigger
4. Confirmation 1 agrees
5. Baseline agrees
6. Confirmation 2 agrees
█ Connecting to Backtests
All GKD indicators are chained indicators meaning you export the value of the indicators to specialized backtest to creat your GKD trading system. Each indicator contains a proprietary signal generation algo that will only work with GKD backtests. You can find these backtests using the links below.
GKD-BT Giga Confirmation Stack Backtest
GKD-BT Giga Stacks Backtest
GKD-BT Full Giga Kaleidoscope Backtest
GKD-BT Solo Confirmation Super Complex Backtest
GKD-BT Solo Confirmation Complex Backtest
GKD-BT Solo Confirmation Simple Backtest
GKD-M Baseline Optimizer
GKD-M Accuracy Alchemist
GKD-BT Multi-Ticker SCC Backtest
GKD-BT Multi-Ticker SCS Backtest
GKD-BT Multi-Ticker SCS Backtest
GKD-BT Multi-Ticker Full GKD Backtest
GKD-M Accuracy Alchemist [Loxx]Giga Kaleidoscope GKD-M Accuracy Alchemist is a Metamorphosis module included in Loxx's "Giga Kaleidoscope Modularized Trading System".
█ GKD-M Accuracy Alchemist
What is the Accuracy Alchemist?
The Accuracy Alchemist is designed to process up to 10 GKD-C indicators and create a compound signal that can be utilized in a GKD-BT backtest. It achieves this by applying an individual Solo Confirmation Simple backtest to each GKD-C indicator provided. The compound signal is derived from the cumulative accuracy rate of each candle within a specified date range.
To illustrate this process, consider the following scenario:
The Fisher Transform indicator has a 65% win rate for long positions on the current ticker.
The Vortex indicator has a 45% success rate on the current candle.
Suppose a long signal is generated by the Vortex indicator. However, this signal is disregarded because its accuracy is lower than that of the Fisher Transform. Now, imagine that the subsequent candle produces a long signal from the Fisher Transform indicator. This signal will be exported to the backtest. The GKD-C indicator that exhibits the highest accuracy for the current candle is chosen to generate the signal. The dominant indicator, determined by its accuracy, will always be used to generate signals. However, it is important to note that the current dominant indicator might not retain its dominance in the future if its accuracy rate falls below that of other indicators connected within the Accuracy Alchemist indicator.
The Accuracy Alchemist provides a comprehensive table that displays the dominant indicator based on accuracy, highlighted in green for the highest long accuracy rate and in red for the highest short accuracy rate. Additionally, the table presents the cumulative long and short accuracy rates for all indicators.
The functionality of the Accuracy Alchemist extends to several GKD-BT backtests, allowing for seamless integration. These backtests include:
-Solo Confirmation Simple
-Solo Confirmation Complex
-Solo Confirmation Super Complex
-Full GKD (as a Confirmation 1 indicator only)
-Confirmation Stack (as a Confirmation 1 indicator only)
By incorporating the Accuracy Alchemist, you gain the ability to evaluate and compare GKD-C Confirmation indicators within your full GKD trading system. It serves as an ideal tool to assess the performance of different confirmation indicators and aids in the selection process for determining which indicators to incorporate into your trading strategy.
Take Profit and Stoploss
The GKD system utilizes volatility-based take profits and stop losses, where each take profit and stop loss is calculated as a multiple of volatility. Users have the flexibility to adjust the multiplier values in the settings to suit their preferences. Accuracy Alchemist tests the accuracy of GKD-C Confirmation indicators and therefore has only 1 take profit and 1 stoploss. You can adjust the multipliers of both in the settings
Setting up Accuracy Alchemist
To use this indicator, you must import GKD-C Confirmation indicators and then activate them in the Accuracy Alchemist settings. Import the value "Input into NEW GKD-BT Backtest" from a GKD-C indicator and then activate it by checking the box next to the import. See below:
Volatility Types Included
17 types of volatility are included in this indicator
Close-to-Close
Parkinson
Garman-Klass
Rogers-Satchell
Yang-Zhang
Garman-Klass-Yang-Zhang
Exponential Weighted Moving Average
Standard Deviation of Log Returns
Pseudo GARCH(2,2)
Average True Range
True Range Double
Standard Deviation
Adaptive Deviation
Median Absolute Deviation
Efficiency-Ratio Adaptive ATR
Mean Absolute Deviation
Static Percent
Close-to-Close
Close-to-Close volatility is a classic and widely used volatility measure, sometimes referred to as historical volatility.
Volatility is an indicator of the speed of a stock price change. A stock with high volatility is one where the price changes rapidly and with a larger amplitude. The more volatile a stock is, the riskier it is.
Close-to-close historical volatility is calculated using only a stock's closing prices. It is the simplest volatility estimator. However, in many cases, it is not precise enough. Stock prices could jump significantly during a trading session and return to the opening value at the end. That means that a considerable amount of price information is not taken into account by close-to-close volatility.
Despite its drawbacks, Close-to-Close volatility is still useful in cases where the instrument doesn't have intraday prices. For example, mutual funds calculate their net asset values daily or weekly, and thus their prices are not suitable for more sophisticated volatility estimators.
Parkinson
Parkinson volatility is a volatility measure that uses the stock’s high and low price of the day.
The main difference between regular volatility and Parkinson volatility is that the latter uses high and low prices for a day, rather than only the closing price. This is useful as close-to-close prices could show little difference while large price movements could have occurred during the day. Thus, Parkinson's volatility is considered more precise and requires less data for calculation than close-to-close volatility.
One drawback of this estimator is that it doesn't take into account price movements after the market closes. Hence, it systematically undervalues volatility. This drawback is addressed in the Garman-Klass volatility estimator.
Garman-Klass
Garman-Klass is a volatility estimator that incorporates open, low, high, and close prices of a security.
Garman-Klass volatility extends Parkinson's volatility by taking into account the opening and closing prices. As markets are most active during the opening and closing of a trading session, it makes volatility estimation more accurate.
Garman and Klass also assumed that the process of price change follows a continuous diffusion process (Geometric Brownian motion). However, this assumption has several drawbacks. The method is not robust for opening jumps in price and trend movements.
Despite its drawbacks, the Garman-Klass estimator is still more effective than the basic formula since it takes into account not only the price at the beginning and end of the time interval but also intraday price extremes.
Researchers Rogers and Satchell have proposed a more efficient method for assessing historical volatility that takes into account price trends. See Rogers-Satchell Volatility for more detail.
Rogers-Satchell
Rogers-Satchell is an estimator for measuring the volatility of securities with an average return not equal to zero.
Unlike Parkinson and Garman-Klass estimators, Rogers-Satchell incorporates a drift term (mean return not equal to zero). As a result, it provides better volatility estimation when the underlying is trending.
The main disadvantage of this method is that it does not take into account price movements between trading sessions. This leads to an underestimation of volatility since price jumps periodically occur in the market precisely at the moments between sessions.
A more comprehensive estimator that also considers the gaps between sessions was developed based on the Rogers-Satchel formula in the 2000s by Yang-Zhang. See Yang Zhang Volatility for more detail.
Yang-Zhang
Yang Zhang is a historical volatility estimator that handles both opening jumps and the drift and has a minimum estimation error.
Yang-Zhang volatility can be thought of as a combination of the overnight (close-to-open volatility) and a weighted average of the Rogers-Satchell volatility and the day’s open-to-close volatility. It is considered to be 14 times more efficient than the close-to-close estimator.
Garman-Klass-Yang-Zhang
Garman-Klass-Yang-Zhang (GKYZ) volatility estimator incorporates the returns of open, high, low, and closing prices in its calculation.
GKYZ volatility estimator takes into account overnight jumps but not the trend, i.e., it assumes that the underlying asset follows a Geometric Brownian Motion (GBM) process with zero drift. Therefore, the GKYZ volatility estimator tends to overestimate the volatility when the drift is different from zero. However, for a GBM process, this estimator is eight times more efficient than the close-to-close volatility estimator.
Exponential Weighted Moving Average
The Exponentially Weighted Moving Average (EWMA) is a quantitative or statistical measure used to model or describe a time series. The EWMA is widely used in finance, with the main applications being technical analysis and volatility modeling.
The moving average is designed such that older observations are given lower weights. The weights decrease exponentially as the data point gets older – hence the name exponentially weighted.
The only decision a user of the EWMA must make is the parameter lambda. The parameter decides how important the current observation is in the calculation of the EWMA. The higher the value of lambda, the more closely the EWMA tracks the original time series.
Standard Deviation of Log Returns
This is the simplest calculation of volatility. It's the standard deviation of ln(close/close(1)).
Pseudo GARCH(2,2)
This is calculated using a short- and long-run mean of variance multiplied by ?.
?avg(var;M) + (1 ? ?) avg(var;N) = 2?var/(M+1-(M-1)L) + 2(1-?)var/(M+1-(M-1)L)
Solving for ? can be done by minimizing the mean squared error of estimation; that is, regressing L^-1var - avg(var; N) against avg(var; M) - avg(var; N) and using the resulting beta estimate as ?.
Average True Range
The average true range (ATR) is a technical analysis indicator, introduced by market technician J. Welles Wilder Jr. in his book New Concepts in Technical Trading Systems, that measures market volatility by decomposing the entire range of an asset price for that period.
The true range indicator is taken as the greatest of the following: current high less the current low; the absolute value of the current high less the previous close; and the absolute value of the current low less the previous close. The ATR is then a moving average, generally using 14 days, of the true ranges.
True Range Double
A special case of ATR that attempts to correct for volatility skew.
Standard Deviation
Standard deviation is a statistic that measures the dispersion of a dataset relative to its mean and is calculated as the square root of the variance. The standard deviation is calculated as the square root of variance by determining each data point's deviation relative to the mean. If the data points are further from the mean, there is a higher deviation within the data set; thus, the more spread out the data, the higher the standard deviation.
Adaptive Deviation
By definition, the Standard Deviation (STD, also represented by the Greek letter sigma ? or the Latin letter s) is a measure that is used to quantify the amount of variation or dispersion of a set of data values. In technical analysis, we usually use it to measure the level of current volatility.
Standard Deviation is based on Simple Moving Average calculation for mean value. This version of standard deviation uses the properties of EMA to calculate what can be called a new type of deviation, and since it is based on EMA, we can call it EMA deviation. Additionally, Perry Kaufman's efficiency ratio is used to make it adaptive (since all EMA type calculations are nearly perfect for adapting).
The difference when compared to the standard is significant--not just because of EMA usage, but the efficiency ratio makes it a "bit more logical" in very volatile market conditions.
Median Absolute Deviation
The median absolute deviation is a measure of statistical dispersion. Moreover, the MAD is a robust statistic, being more resilient to outliers in a data set than the standard deviation. In the standard deviation, the distances from the mean are squared, so large deviations are weighted more heavily, and thus outliers can heavily influence it. In the MAD, the deviations of a small number of outliers are irrelevant.
Because the MAD is a more robust estimator of scale than the sample variance or standard deviation, it works better with distributions without a mean or variance, such as the Cauchy distribution.
Efficiency-Ratio Adaptive ATR
Average True Range (ATR) is a widely used indicator for many occasions in technical analysis. It is calculated as the RMA of the true range. This version adds a "twist": it uses Perry Kaufman's Efficiency Ratio to calculate adaptive true range.
Mean Absolute Deviation
The mean absolute deviation (MAD) is a measure of variability that indicates the average distance between observations and their mean. MAD uses the original units of the data, which simplifies interpretation. Larger values signify that the data points spread out further from the average. Conversely, lower values correspond to data points bunching closer to it. The mean absolute deviation is also known as the mean deviation and average absolute deviation.
This definition of the mean absolute deviation sounds similar to the standard deviation (SD). While both measure variability, they have different calculations. In recent years, some proponents of MAD have suggested that it replace the SD as the primary measure because it is a simpler concept that better fits real life.
Static Percent
Static Percent allows the user to insert their own constant percent that will then be used to create take profits and stoploss
█ Giga Kaleidoscope Modularized Trading System
Core components of an NNFX algorithmic trading strategy
The NNFX algorithm is built on the principles of trend, momentum, and volatility. There are six core components in the NNFX trading algorithm:
1. Volatility - price volatility; e.g., Average True Range, True Range Double, Close-to-Close, etc.
2. Baseline - a moving average to identify price trend
3. Confirmation 1 - a technical indicator used to identify trends
4. Confirmation 2 - a technical indicator used to identify trends
5. Continuation - a technical indicator used to identify trends
6. Volatility/Volume - a technical indicator used to identify volatility/volume breakouts/breakdown
7. Exit - a technical indicator used to determine when a trend is exhausted
8. Metamorphosis - a technical indicator that produces a compound signal from the combination of other GKD indicators*
*(not part of the NNFX algorithm)
What is Volatility in the NNFX trading system?
In the NNFX (No Nonsense Forex) trading system, ATR (Average True Range) is typically used to measure the volatility of an asset. It is used as a part of the system to help determine the appropriate stop loss and take profit levels for a trade. ATR is calculated by taking the average of the true range values over a specified period.
True range is calculated as the maximum of the following values:
-Current high minus the current low
-Absolute value of the current high minus the previous close
-Absolute value of the current low minus the previous close
ATR is a dynamic indicator that changes with changes in volatility. As volatility increases, the value of ATR increases, and as volatility decreases, the value of ATR decreases. By using ATR in NNFX system, traders can adjust their stop loss and take profit levels according to the volatility of the asset being traded. This helps to ensure that the trade is given enough room to move, while also minimizing potential losses.
Other types of volatility include True Range Double (TRD), Close-to-Close, and Garman-Klass
What is a Baseline indicator?
The baseline is essentially a moving average, and is used to determine the overall direction of the market.
The baseline in the NNFX system is used to filter out trades that are not in line with the long-term trend of the market. The baseline is plotted on the chart along with other indicators, such as the Moving Average (MA), the Relative Strength Index (RSI), and the Average True Range (ATR).
Trades are only taken when the price is in the same direction as the baseline. For example, if the baseline is sloping upwards, only long trades are taken, and if the baseline is sloping downwards, only short trades are taken. This approach helps to ensure that trades are in line with the overall trend of the market, and reduces the risk of entering trades that are likely to fail.
By using a baseline in the NNFX system, traders can have a clear reference point for determining the overall trend of the market, and can make more informed trading decisions. The baseline helps to filter out noise and false signals, and ensures that trades are taken in the direction of the long-term trend.
What is a Confirmation indicator?
Confirmation indicators are technical indicators that are used to confirm the signals generated by primary indicators. Primary indicators are the core indicators used in the NNFX system, such as the Average True Range (ATR), the Moving Average (MA), and the Relative Strength Index (RSI).
The purpose of the confirmation indicators is to reduce false signals and improve the accuracy of the trading system. They are designed to confirm the signals generated by the primary indicators by providing additional information about the strength and direction of the trend.
Some examples of confirmation indicators that may be used in the NNFX system include the Bollinger Bands, the MACD (Moving Average Convergence Divergence), and the MACD Oscillator. These indicators can provide information about the volatility, momentum, and trend strength of the market, and can be used to confirm the signals generated by the primary indicators.
In the NNFX system, confirmation indicators are used in combination with primary indicators and other filters to create a trading system that is robust and reliable. By using multiple indicators to confirm trading signals, the system aims to reduce the risk of false signals and improve the overall profitability of the trades.
What is a Continuation indicator?
In the NNFX (No Nonsense Forex) trading system, a continuation indicator is a technical indicator that is used to confirm a current trend and predict that the trend is likely to continue in the same direction. A continuation indicator is typically used in conjunction with other indicators in the system, such as a baseline indicator, to provide a comprehensive trading strategy.
What is a Volatility/Volume indicator?
Volume indicators, such as the On Balance Volume (OBV), the Chaikin Money Flow (CMF), or the Volume Price Trend (VPT), are used to measure the amount of buying and selling activity in a market. They are based on the trading volume of the market, and can provide information about the strength of the trend. In the NNFX system, volume indicators are used to confirm trading signals generated by the Moving Average and the Relative Strength Index. Volatility indicators include Average Direction Index, Waddah Attar, and Volatility Ratio. In the NNFX trading system, volatility is a proxy for volume and vice versa.
By using volume indicators as confirmation tools, the NNFX trading system aims to reduce the risk of false signals and improve the overall profitability of trades. These indicators can provide additional information about the market that is not captured by the primary indicators, and can help traders to make more informed trading decisions. In addition, volume indicators can be used to identify potential changes in market trends and to confirm the strength of price movements.
What is an Exit indicator?
The exit indicator is used in conjunction with other indicators in the system, such as the Moving Average (MA), the Relative Strength Index (RSI), and the Average True Range (ATR), to provide a comprehensive trading strategy.
The exit indicator in the NNFX system can be any technical indicator that is deemed effective at identifying optimal exit points. Examples of exit indicators that are commonly used include the Parabolic SAR, the Average Directional Index (ADX), and the Chandelier Exit.
The purpose of the exit indicator is to identify when a trend is likely to reverse or when the market conditions have changed, signaling the need to exit a trade. By using an exit indicator, traders can manage their risk and prevent significant losses.
In the NNFX system, the exit indicator is used in conjunction with a stop loss and a take profit order to maximize profits and minimize losses. The stop loss order is used to limit the amount of loss that can be incurred if the trade goes against the trader, while the take profit order is used to lock in profits when the trade is moving in the trader's favor.
Overall, the use of an exit indicator in the NNFX trading system is an important component of a comprehensive trading strategy. It allows traders to manage their risk effectively and improve the profitability of their trades by exiting at the right time.
What is an Metamorphosis indicator?
The concept of a metamorphosis indicator involves the integration of two or more GKD indicators to generate a compound signal. This is achieved by evaluating the accuracy of each indicator and selecting the signal from the indicator with the highest accuracy. As an illustration, let's consider a scenario where we calculate the accuracy of 10 indicators and choose the signal from the indicator that demonstrates the highest accuracy.
The resulting output from the metamorphosis indicator can then be utilized in a GKD-BT backtest by occupying a slot that aligns with the purpose of the metamorphosis indicator. The slot can be a GKD-B, GKD-C, or GKD-E slot, depending on the specific requirements and objectives of the indicator. This allows for seamless integration and utilization of the compound signal within the GKD-BT framework.
How does Loxx's GKD (Giga Kaleidoscope Modularized Trading System) implement the NNFX algorithm outlined above?
Loxx's GKD v2.0 system has five types of modules (indicators/strategies). These modules are:
1. GKD-BT - Backtesting module (Volatility, Number 1 in the NNFX algorithm)
2. GKD-B - Baseline module (Baseline and Volatility/Volume, Numbers 1 and 2 in the NNFX algorithm)
3. GKD-C - Confirmation 1/2 and Continuation module (Confirmation 1/2 and Continuation, Numbers 3, 4, and 5 in the NNFX algorithm)
4. GKD-V - Volatility/Volume module (Confirmation 1/2, Number 6 in the NNFX algorithm)
5. GKD-E - Exit module (Exit, Number 7 in the NNFX algorithm)
6. GKD-M - Metamorphosis module (Metamorphosis, Number 8 in the NNFX algorithm, but not part of the NNFX algorithm)
(additional module types will added in future releases)
Each module interacts with every module by passing data to A backtest module wherein the various components of the GKD system are combined to create a trading signal.
That is, the Baseline indicator passes its data to Volatility/Volume. The Volatility/Volume indicator passes its values to the Confirmation 1 indicator. The Confirmation 1 indicator passes its values to the Confirmation 2 indicator. The Confirmation 2 indicator passes its values to the Continuation indicator. The Continuation indicator passes its values to the Exit indicator, and finally, the Exit indicator passes its values to the Backtest strategy.
This chaining of indicators requires that each module conform to Loxx's GKD protocol, therefore allowing for the testing of every possible combination of technical indicators that make up the six components of the NNFX algorithm.
What does the application of the GKD trading system look like?
Example trading system:
Backtest: Full GKD Backtest
Baseline: Hull Moving Average
Volatility/Volume: Hurst Exponent
Confirmation 1: Composite RSI
Confirmation 2: uf2018
Continuation: Vortex
Exit: Rex Oscillator
Metamorphosis: Fisher Transform, Universal Oscillator, Aroon, Vortex .. combined
Each GKD indicator is denoted with a module identifier of either: GKD-BT, GKD-B, GKD-C, GKD-V, or GKD-E. This allows traders to understand to which module each indicator belongs and where each indicator fits into the GKD system.
█ Giga Kaleidoscope Modularized Trading System Signals
Standard Entry
1. GKD-C Confirmation gives signal
2. Baseline agrees
3. Price inside Goldie Locks Zone Minimum
4. Price inside Goldie Locks Zone Maximum
5. Confirmation 2 agrees
6. Volatility/Volume agrees
1-Candle Standard Entry
1a. GKD-C Confirmation gives signal
2a. Baseline agrees
3a. Price inside Goldie Locks Zone Minimum
4a. Price inside Goldie Locks Zone Maximum
Next Candle
1b. Price retraced
2b. Baseline agrees
3b. Confirmation 1 agrees
4b. Confirmation 2 agrees
5b. Volatility/Volume agrees
Baseline Entry
1. GKD-B Basline gives signal
2. Confirmation 1 agrees
3. Price inside Goldie Locks Zone Minimum
4. Price inside Goldie Locks Zone Maximum
5. Confirmation 2 agrees
6. Volatility/Volume agrees
7. Confirmation 1 signal was less than 'Maximum Allowable PSBC Bars Back' prior
1-Candle Baseline Entry
1a. GKD-B Baseline gives signal
2a. Confirmation 1 agrees
3a. Price inside Goldie Locks Zone Minimum
4a. Price inside Goldie Locks Zone Maximum
5a. Confirmation 1 signal was less than 'Maximum Allowable PSBC Bars Back' prior
Next Candle
1b. Price retraced
2b. Baseline agrees
3b. Confirmation 1 agrees
4b. Confirmation 2 agrees
5b. Volatility/Volume agrees
Volatility/Volume Entry
1. GKD-V Volatility/Volume gives signal
2. Confirmation 1 agrees
3. Price inside Goldie Locks Zone Minimum
4. Price inside Goldie Locks Zone Maximum
5. Confirmation 2 agrees
6. Baseline agrees
7. Confirmation 1 signal was less than 7 candles prior
1-Candle Volatility/Volume Entry
1a. GKD-V Volatility/Volume gives signal
2a. Confirmation 1 agrees
3a. Price inside Goldie Locks Zone Minimum
4a. Price inside Goldie Locks Zone Maximum
5a. Confirmation 1 signal was less than 'Maximum Allowable PSVVC Bars Back' prior
Next Candle
1b. Price retraced
2b. Volatility/Volume agrees
3b. Confirmation 1 agrees
4b. Confirmation 2 agrees
5b. Baseline agrees
Confirmation 2 Entry
1. GKD-C Confirmation 2 gives signal
2. Confirmation 1 agrees
3. Price inside Goldie Locks Zone Minimum
4. Price inside Goldie Locks Zone Maximum
5. Volatility/Volume agrees
6. Baseline agrees
7. Confirmation 1 signal was less than 7 candles prior
1-Candle Confirmation 2 Entry
1a. GKD-C Confirmation 2 gives signal
2a. Confirmation 1 agrees
3a. Price inside Goldie Locks Zone Minimum
4a. Price inside Goldie Locks Zone Maximum
5a. Confirmation 1 signal was less than 'Maximum Allowable PSC2C Bars Back' prior
Next Candle
1b. Price retraced
2b. Confirmation 2 agrees
3b. Confirmation 1 agrees
4b. Volatility/Volume agrees
5b. Baseline agrees
PullBack Entry
1a. GKD-B Baseline gives signal
2a. Confirmation 1 agrees
3a. Price is beyond 1.0x Volatility of Baseline
Next Candle
1b. Price inside Goldie Locks Zone Minimum
2b. Price inside Goldie Locks Zone Maximum
3b. Confirmation 1 agrees
4b. Confirmation 2 agrees
5b. Volatility/Volume agrees
Continuation Entry
1. Standard Entry, 1-Candle Standard Entry, Baseline Entry, 1-Candle Baseline Entry, Volatility/Volume Entry, 1-Candle Volatility/Volume Entry, Confirmation 2 Entry, 1-Candle Confirmation 2 Entry, or Pullback entry triggered previously
2. Baseline hasn't crossed since entry signal trigger
4. Confirmation 1 agrees
5. Baseline agrees
6. Confirmation 2 agrees
█ Connecting to Backtests
All GKD indicators are chained indicators meaning you export the value of the indicators to specialized backtest to creat your GKD trading system. Each indicator contains a proprietary signal generation algo that will only work with GKD backtests. You can find these backtests using the links below.
GKD-BT Giga Confirmation Stack Backtest:
GKD-BT Giga Stacks Backtest:
GKD-BT Full Giga Kaleidoscope Backtest:
GKD-BT Solo Confirmation Super Complex Backtest:
GKD-BT Solo Confirmation Complex Backtest:
GKD-BT Solo Confirmation Simple Backtest:

MACD Strategy - Backtest [AlgoRider]█ OVERVIEW
Hello dear Tradingviewers !
We are excited to share with you this new indicator which simulates a trading strategy based solely on the well-known technical indicator MACD . We designed it for the sole educational and analytical purposes of showing novice traders and new investors that basing a trading strategy only on one such technical indicator is not necessarily a good thing to do. We do not recommend to apply this strategy for real.
Thanks to this indicator redesigned in our own way by incorporating our simple and easy-to-use Backtest functionality, you will be able to see and report on the performance and results that such a strategy has produced in the past.
The configuration window has also been designed to be easily readable and simple to use. Our goal is to make parameter customization as easy as possible.
█ HOW THE STRATEGY WORKS
• The script will simply trigger Long entries when bullish MACD crossings appear (the Macd line crosses the Signal line upwards) and Short entries when bearish MACD crossings appear (the Macd line crosses below the signal line).
• A Short signal ends a Long trade, a Long signal ends a Short trade.
• The script also allows setting up custom TP and SL.
• An option allows you to trigger early crossings, which will influence entries and exits.
• There is no repaint, once an entry/exit symbol or drawing is displayed it doesn't change anymore. The Short and Long signals appear at the open of the candles, just after the signal was confirmed at the close of the previous candle. The custom TP and custom SL signals can appear when a candle is not yet finished, but once displayed they don't change.
█ HOW TO PROCEED
1 — Once the script is applied to your chart, it already works with its default settings. You can already see the performance of the strategy in the data table directly on the chart (in the top right corner by default).
2 — You can customize the strategy and influence the results/performance by modifying its parameters. 3 types of parameters are present and can be modified.
3 — You can use this indicator in all types of markets.
4 — You can apply the script in every timeframe.
█ PARAMETERS
• Settings For Backtesting
- Strategy : Choose from a drop-down list if the strategy should execute only Long trades or only Short trades or both. Default Both.
- Invest. : Choose the amount you want to invest in the simulation. Default 10000.
- Position : Choose the amount of the position (Size order) that will be used during the simulation. This will be the $ amount staked/involved for each trade entry.
Ex: If you put 20000 in position and 10000 in Invest. We consider that you use at least a leverage x2. Default 10000.
- Slipp. TP : Choose the amount in percentage of average slippage for Take Profits. This parameter makes it possible to predict a potential gap between the theoretical exit price for each TP (On the graph) and the real exit price on an exchange when implementing the strategy for real (slippage may be due to a time lag of a few seconds from execution time of the order on the exchange and/or due to the execution of a market order).
Ex: If a TP exit order of a Long trade, with entry $19000 (on BTCUSDT ), is carried out in theory on the chart at $20000, in practice on the exchange the script have indeed sent an exit order at 20000 , but if the true exit price is 20050, the TP slippage is then +0.25%. Default 0.
- Slipp. SL : Choose the amount in percentage of average slippage for Stop Losses. This parameter makes it possible to predict a potential gap between the theoretical exit price for each SL (On the graph) and the real exit price on an exchange when implementing the strategy for real.
Ex: If an SL exit order of a Long trade, entry $19000 (on BTCUSDT ), is carried out in theory on the chart at $18000, in practice on the exchange the script have indeed sent an exit order at 18000 $, but if the true exit price is 17950, the slippage SL is then +0.278%. Default 0.
- Fees % : Choose the percentage amount of fees applied to each trade to simulate the application of the strategy on the exchange of your choice. Applies to the entry and exit of each trade. Ex: For Binance Futures: 0.04; For Bybit futures: 0.06; For Ftx Futures: 0.075. Default 0.
- Cumulate Trades : If you check this, the Backtest will use 100% of the balance as Order Size (Position) for All or in the next X consecutive trades. Default not checked.
⚠️ Be Careful please, this option is available to show the full extent and possibilities of the algorithm when pushed to its limits thanks to the accumulation of profits (cumulative earnings ), but it is a strategy that involves great risk. If a bad trade suffers a -50% loss, 50% of the account balance is lost, if the position is liquidated, the entire account balance is lost.
- All : If you check this All trades will be accumulated. Default not checked.
- Consecutive Trades : Choose the number of trades to accumulate. After X consecutive trades, the algorithm reassigns the initial order size to the current one and starts again for X consecutive trades. Minimum Value 2, Default 2.
• Settings To Optimize Performances and Risk Management
- Fast_MA : Choose the length of the Fast Moving Average. Default 12.
- Slow_MA : Choose the length of the Slow Moving Average. Default 26.
- Enable Early Crossings : If you check this, when the algorithm will detect an early crossing wethere bullish or bearish , it will trigger the Long or Short entries. Default not checked.
- Oscillator MA Type : Choose if the Macd line should be an Exponential Moving Average or a Simple Moving Average . Default Expo.
- Signal Line MA Type : Choose if the Signal line should be an Exponential Moving Average or a Simple Moving Average . Default Expo.
- Use TP / Use SL : If you check these, the algorithm will trigger personalized trade exit signals when the price evolution has reached the amounts indicated since the trade entry. Default not Checked.
- % TP - SL : Indicate here the personalized amount in percentage that you want for your Take Profit and Stop Loss of each trade. Default 15-5.
• Settings For Appearances
- Small-size Data Table : If you check this, the data table will become smaller to free up more space on the chart to make it visually more pleasing. Default not checked.
Hide Table /
- Hide Labels / : You can check these to get a cleaner chart and focus only on what interests you in the indicator. Default not checked.
Hide Risk-Reward Areas
█ LIMITATIONS
• ⚠️ We repeat it once again, this strategy is not intended to be reproduced in real conditions, we have designed it for educational and analytical purposes only.
• Even if you see good performances when you backtest the strategy, you must take into account that these results are performed in the past and that in no case does this guarantee that these same performances will be repeated again in the future.
• When you run for real a trading strategy you must be aware of the fact that you are solely responsible for the results that you will be able to obtain and you must be aware of the possibility at all times of partial or even total losses of your invested capital.
• Keep in mind that generating profits in trading is difficult. A strategy can perform very well at one time in the past during a period that is favorable to it, then from one day to the next it can give really bad results for several months or years.
• When backtesting a trading strategy, there are many factors to consider, not just trade entries to which you add a Take Profit and sometimes a Stop Loss. You must at least take into account the size of the position in relation to the capital you want to invest, the trading fees, the slippages (which can be really important depending on the exchange on which you are trading and depending on the asset you are trading), trading frequency, risk management, momentum, volumes and even more.
The information published here on TradingView is not prohibited, doesn't constitute investment advice, and isn't created solely for qualified investors.
═════════════════════════════════════════════════════════════════════════
Important to note : our indicators with the same backtesting system are published in separate publications, because putting them together in a single script would considerably slow down the execution of the script. In addition each indicator, even when it is based on a simple technical indicator, has several options, parameters and entry/exit conditions specific to the underlying technical indicator. Finally, we want to keep the simplicity of use, configuration and understanding of our indicator by not mixing strategies that have nothing to do with each other.
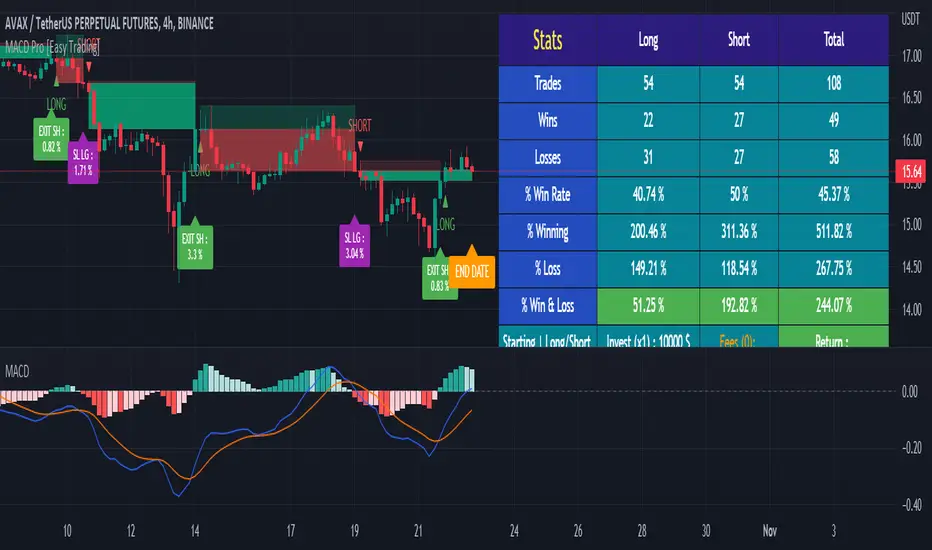
VMDM - Volume, Momentum & Divergence Master [BullByte]VMDM - Volume, Momentum and Divergence Master
Educational Multi-Layer Market Structure Analysis System
Multi-factor divergence engine that scores RSI momentum, volume pressure, and institutional footprints into one non-repainting confluence rating (0-100).
WHAT THIS INDICATOR IS
VMDM is an educational indicator designed to teach traders how to recognize high-probability reversal and continuation patterns by analyzing four independent market dimensions simultaneously. Instead of relying on a single indicator that may produce frequent false signals, VMDM creates a confluence-based scoring system that weights multiple confirmation factors, helping you understand which setups have stronger technical backing and which are lower quality.
This is NOT a trading system or signal generator. It is a learning tool that visualizes complex market structure concepts in an accessible format for both coders and non-coders.
THE PROBLEM IT SOLVES
Most traders face these common challenges:
Challenge 1 - Indicator Overload: Running RSI, volume analysis, and divergence detection separately creates chart clutter and conflicting signals. You waste time cross-referencing multiple windows trying to determine if all factors align.
Challenge 2 - False Divergences: Standard divergence indicators trigger on every minor pivot, creating noise. Many divergences fail because they lack supporting evidence from volume or market structure.
Challenge 3 - Missed Context: A bullish RSI divergence means nothing if it occurs during weak volume or in the middle of strong distribution. Context determines quality.
Challenge 4 - Repainting Confusion: Many divergence scripts repaint, showing perfect historical signals that never actually triggered in real-time, leading to false confidence.
Challenge 5 - Institutional Pattern Recognition: Absorption zones, stop hunts, and exhaustion patterns are taught in trading education but difficult to identify systematically without manual analysis.
VMDM addresses all five challenges by combining complementary analytical layers into one transparent, non-repainting, confluence-weighted system with visual clarity.
WHY THIS SPECIFIC COMBINATION - MASHUP JUSTIFICATION
This indicator is NOT a random mashup of popular indicators. Each of the four layers serves a specific analytical purpose and together they create a complete market structure assessment framework.
THE FOUR ANALYTICAL LAYERS
LAYER 1 - RSI MOMENTUM DIVERGENCE (Trend Exhaustion Detection)
Purpose: Identifies when price momentum is weakening before price itself reverses.
Why RSI: The Relative Strength Index measures momentum on a bounded 0-100 scale, making divergence detection mathematically consistent across all assets and timeframes. Unlike raw price oscillators, RSI normalizes momentum regardless of volatility regime.
How It Contributes: Divergence between price pivots and RSI pivots reveals early momentum exhaustion. A lower price low with a higher RSI low (bullish regular divergence) signals sellers are losing strength even as price makes new lows. This is the PRIMARY signal generator in VMDM.
Limitation If Used Alone: RSI divergence by itself produces many false signals because momentum can remain weak during continued trends. It needs confirmation from volume and structural evidence.
LAYER 2 - VOLUME PRESSURE ANALYSIS (Buying vs Selling Intensity)
Purpose: Quantifies whether the current bar's volume reflects buying pressure or selling pressure based on where price closed within the bar's range.
Methodology: Instead of just measuring volume size, VMDM calculates WHERE in the bar range the close occurred. A close near the high on high volume indicates strong buying absorption. A close near the low indicates selling pressure. The calculation accounts for wick size (wicks reduce pressure quality) and uses percentile ranking over a lookback period to normalize pressure strength on a 0-100 scale.
Formula Concept:
Buy Pressure = Volume × (Close - Low) / (High - Low) × Wick Quality Factor
Sell Pressure = Volume × (High - Close) / (High - Low) × Wick Quality Factor
Net Pressure = Buy Pressure - Sell Pressure
Pressure Strength = Percentile Rank of Net Pressure over lookback period
Why Percentile Ranking: Absolute volume varies by asset and session. Percentile ranking makes 85th percentile pressure on low-volume crypto comparable to 85th percentile pressure on high-volume forex.
How It Contributes: When a bullish divergence occurs at a pivot low AND pressure strength is above 60 (strong buying), this adds 25 confluence points. It confirms that the divergence is occurring during actual accumulation, not just weak selling.
Limitation If Used Alone: Pressure analysis shows current bar intensity but cannot identify trend exhaustion or reversal timing. High buying pressure can exist during a strong uptrend with no reversal imminent.
LAYER 3 - BEHAVIORAL FOOTPRINT PATTERNS (Volume Anomaly Detection)
CRITICAL DISCLAIMER: The terms "institutional footprint," "absorption," "stop hunt," and "exhaustion" used in this indicator are EDUCATIONAL LABELS for specific price and volume behavioral patterns. These patterns are detected through technical analysis of publicly available price, volume, and bar structure data. This indicator does NOT have access to actual institutional order flow, market maker data, broker stop-loss locations, or any non-public data source. These pattern names are used because they are common terminology in trading education to describe these technical behaviors. The analysis is interpretive and based on observable price action, not privileged information.
Purpose: Detect volume anomalies and price patterns that historically correlate with potential reversal zones or trend continuation failure.
Pattern Type 1 - Absorption (Labeled as "ACCUMULATION" or "DISTRIBUTION")
Detection Criteria: Volume is more than 2x the moving average AND bar range is less than 50 percent of the average bar range.
Interpretation: High volume compressed into a tight range suggests large participants are absorbing supply (accumulation) or distribution (distribution) without allowing price to move significantly. This often precedes directional moves once absorption completes.
Visual: Colored box zone highlighting the absorption area.
Pattern Type 2 - Stop Hunt (Labeled as "BULL HUNT" or "BEAR HUNT")
Detection Criteria: Price penetrates a recent 10-bar high or low by a small margin (0.2 percent), then closes back inside the range on above-average volume (1.5x+).
Interpretation: Price briefly spikes beyond recent structure (likely triggering stop losses placed just beyond obvious levels) then reverses. This is a classic false breakout pattern often seen before reversals.
Visual: Label at the wick extreme showing hunt direction.
Pattern Type 3 - Exhaustion (Labeled as "SELL EXHAUST" or "BUY EXHAUST")
Detection Criteria: Lower wick is more than 2.5x the body size with volume above 1.8x average and RSI below 35 (sell exhaustion), OR upper wick more than 2.5x body size with volume above 1.8x average and RSI above 65 (buy exhaustion).
Interpretation: Large wicks with high volume and extreme RSI suggest aggressive buying or selling was met with equally aggressive rejection. This exhaustion often marks short-term extremes.
Visual: Label showing exhaustion type.
How These Contribute: When a divergence forms at a pivot AND one of these behavioral patterns is active, the confluence score increases by 20 points. This confirms the divergence is occurring during structural anomaly activity, not just normal price flow.
Limitation If Used Alone: These patterns can occur mid-trend and do not indicate direction without momentum context. Absorption in a strong uptrend may just be continuation accumulation.
LAYER 4 - CONFLUENCE SCORING MATRIX (Quality Weighting System)
Purpose: Translate all detected conditions into a single 0-100 quality score so you can objectively compare setups.
Scoring Breakdown:
Divergence Present: +30 points (primary signal)
Pressure Confirmation: +25 points (volume supports direction)
Behavioral Footprint Active: +20 points (structural anomaly present)
RSI Extreme: +15 points (RSI below 30 or above 70 at pivot)
Volume Spike: +10 points (current volume above 1.5x average)
Maximum Possible Score: 100 points
Why These Weights: The weights reflect reliability hierarchy based on backtesting observation. Divergence is the core signal (30 points), but without volume confirmation (25 points) many fail. Behavioral patterns add meaningful context (20 points). RSI extremes and volume spikes are secondary confirmations (15 and 10 points).
Quality Tiers:
90-100: TEXTBOOK (all factors aligned)
75-89: HIGH QUALITY (strong confluence)
60-74: VALID (meets minimum threshold)
Below 60: DEVELOPING (not displayed unless threshold lowered)
How It Contributes: The confluence score allows you to filter noise. You can set your minimum quality threshold in settings. Higher thresholds (75+) show fewer but higher-quality patterns. Lower thresholds (50-60) show more patterns but include lower-confidence setups. This teaches you to distinguish strong setups from weak ones.
Limitation: Confluence scoring is historical observation-based, not predictive guarantee. A 95-point setup can still fail. The score represents technical alignment, not future certainty.
WHY THIS COMBINATION WORKS TOGETHER
Each layer addresses a limitation in the others:
RSI Divergence identifies WHEN momentum is exhausting (timing)
Volume Pressure confirms WHETHER the exhaustion is accompanied by opposite-side accumulation (confirmation)
Behavioral Footprint shows IF structural anomalies support the reversal hypothesis (context)
Confluence Scoring weights ALL factors into an objective quality metric (filtering)
Using only RSI divergence gives you timing without confirmation. Using only volume pressure gives you intensity without directional context. Using only pattern detection gives you anomalies without trend exhaustion context. Using all four together creates a complete analytical framework where each layer compensates for the others' weaknesses.
This is not a mashup for the sake of combining indicators. It is a structured analytical system where each component has a defined role in a multi-dimensional market assessment process.
HOW TO READ THE INDICATOR - VISUAL ELEMENTS GUIDE
VMDM displays up to five visual layer types. You can enable or disable each layer independently in settings under "Visual Layers."
VISUAL LAYER 1 - MARKET STRUCTURE (Pivot Points and Lines)
What You See:
Small labels at swing highs and lows marked "PH" (Pivot High) and "PL" (Pivot Low) with horizontal dashed lines extending right from each pivot.
What It Means:
These are CONFIRMED pivots, not real-time. A pivot low appears AFTER the required right-side confirmation bars pass (default 3 bars). This creates a delay but prevents repainting. The pivot only appears once it is mathematically confirmed.
The horizontal lines represent support (from pivot lows) and resistance (from pivot highs) levels where price previously found significant rejection.
Color Coding:
Green label and line: Pivot Low (potential support)
Red label and line: Pivot High (potential resistance)
How To Use:
These pivots are the foundation for divergence detection. Divergence is only calculated between confirmed pivots, ensuring all signals are non-repainting. The lines help you see historical structure levels.
VISUAL LAYER 2 - PRESSURE ZONES (Background Color)
What You See:
Subtle background color shading on bars - light green or light red tint.
What It Means:
This visualizes volume pressure strength in real-time.
Color Coding:
Light Green Background: Pressure Strength above 70 (strong buying pressure - price closing near highs on volume)
Light Red Background: Pressure Strength below 30 (strong selling pressure - price closing near lows on volume)
No Color: Neutral pressure (pressure between 30-70)
How To Use:
When a bullish divergence pattern appears during green pressure zones, it suggests the divergence is forming during accumulation. When a bearish divergence appears during red zones, distribution is occurring. Pressure zones help you filter divergences - those forming in supportive pressure environments have higher probability.
VISUAL LAYER 3 - DIVERGENCE LINES (Dotted Connectors)
What You See:
Dotted lines connecting two pivot points (either two pivot lows or two pivot highs).
What It Means:
A divergence has been detected between those two pivots. The line connects the price pivots where RSI showed opposite behavior.
Color Coding:
Bright Green Line: Bullish divergence (regular or hidden)
Bright Red Line: Bearish divergence (regular or hidden)
How To Use:
The divergence line appears ONLY after the second pivot is confirmed (delayed by right-side confirmation bars). This is intentional to prevent repainting. When you see the line appear, it means:
For Bullish Regular Divergence:
Price made a lower low (second pivot lower than first)
RSI made a higher low (RSI at second pivot higher than first)
Interpretation: Downtrend losing momentum
For Bullish Hidden Divergence:
Price made a higher low (second pivot higher than first)
RSI made a lower low (RSI at second pivot lower than first)
Interpretation: Uptrend continuation likely (pullback within uptrend)
For Bearish Regular Divergence:
Price made a higher high (second pivot higher than first)
RSI made a lower high (RSI at second pivot lower than first)
Interpretation: Uptrend losing momentum
For Bearish Hidden Divergence:
Price made a lower high (second pivot lower than first)
RSI made a higher high (RSI at second pivot higher than first)
Interpretation: Downtrend continuation likely (bounce within downtrend)
If "Show Consolidated Analysis Label" is disabled, a small label will appear on the divergence line showing the divergence type abbreviation.
VISUAL LAYER 4 - BEHAVIORAL FOOTPRINT MARKERS
What You See:
Boxes, labels, and markers at specific bars showing pattern detection.
ABSORPTION ZONES (Boxes):
Colored rectangular boxes spanning one or more bars.
Purple Box: Accumulation absorption zone (high volume, tight range, bullish close)
Red Box: Distribution absorption zone (high volume, tight range, bearish close)
If absorption continues for multiple consecutive bars, the box extends and a counter appears in the label showing how many bars the absorption lasted.
What It Means: Large volume is being absorbed without significant price movement. This often precedes directional breakouts once the absorption phase completes.
STOP HUNT MARKERS (Labels):
Small labels below or above wicks labeled "BULL HUNT" or "BEAR HUNT" (may show bar count if consecutive).
What It Means:
BULL HUNT : Price spiked below recent lows then reversed back up on volume - likely triggered sell stops before reversing
BEAR HUNT : Price spiked above recent highs then reversed back down on volume - likely triggered buy stops before reversing
EXHAUSTION MARKERS (Labels):
Labels showing "SELL EXHAUST" or "BUY EXHAUST."
What It Means:
SELL EXHAUST : Large lower wick with high volume and low RSI - aggressive selling met with strong rejection
BUY EXHAUST : Large upper wick with high volume and high RSI - aggressive buying met with strong rejection
How To Use:
These markers help you identify WHERE structural anomalies occurred. When a divergence signal appears AT THE SAME TIME as one of these patterns, the confluence score increases. You are looking for alignment - divergence + behavioral pattern + pressure confirmation = high-quality setup.
VISUAL LAYER 5 - CONSOLIDATED ANALYSIS LABEL (Main Pattern Signal)
What You See:
A large label appearing at pivot points (or in real-time mode, at current bar) containing full pattern analysis.
Label Appearance:
Depending on your "Use Compact Label Format" setting:
COMPACT MODE (Single Line):
Example: "BULLISH REGULAR | Q:HIGH QUALITY C:82"
Breakdown:
BULLISH REGULAR: Divergence type detected
Q:HIGH QUALITY: Pattern quality tier
C:82: Confluence score (82 out of 100)
FULL MODE (Multi-Line Detailed):
Example:
PATTERN DETECTED
-------------------
BULLISH REGULAR
Quality: HIGH QUALITY
Price: Lower Low
Momentum: Higher Low
Signal: Weakening Downtrend
CONFLUENCE: 82/100
-------------------
Divergence: 30
Pressure: 25
Institutional: 20
RSI Extreme: 0
Volume: 10
Breakdown:
Top section: Pattern type and quality
Middle section: Divergence explanation (what price did vs what RSI did)
Bottom section: Confluence score with itemized breakdown showing which factors contributed
Label Position:
In Confirmed modes: Label appears AT the pivot point (delayed by confirmation bars)
In Real-time mode: Label appears at current bar as conditions develop
Label Color:
Gold: Textbook quality (90+ confluence)
Green: High quality (75-89 confluence)
Blue: Valid quality (60-74 confluence)
How To Use:
This is your primary decision-making label. When it appears:
Check the divergence type (regular divergences are reversal signals, hidden divergences are continuation signals)
Review the quality tier (textbook and high quality have better historical win rates)
Examine the confluence breakdown to see which factors are present and which are missing
Look at the chart context (trend, support/resistance, timeframe)
Use this information to assess whether the setup aligns with your strategy
The label does NOT tell you to buy or sell. It tells you a technical pattern has formed and provides the quality assessment. Your trading decision must incorporate risk management, market context, and your strategy rules.
UNDERSTANDING THE THREE DETECTION MODES
VMDM offers three signal detection modes in settings to accommodate different trading styles and learning objectives.
MODE 1: "Confluence Only (Real-Time)"
How It Works: Displays signals AS THEY DEVELOP on the current bar without waiting for pivot confirmation. The system calculates confluence score from pressure, volume, RSI extremes, and behavioral patterns. Divergence signals are NOT required in this mode.
Delay: ZERO - signals appear immediately.
Use Case: Real-time scanning for high-confluence zones without divergence requirement. Useful for intraday traders who want immediate alerts when multiple factors align.
Tradeoff: More frequent signals but includes setups without confirmed divergence. Higher false signal rate. Signals can change as the bar develops (not repainting in historical bars, but current bar updates).
Visual Behavior: Labels appear at the current bar. No divergence lines unless divergence happens to be present.
MODE 2: "Divergence + Confluence (Confirmed)" - DEFAULT RECOMMENDED
How It Works: Full system engagement. Signals appear ONLY when:
A pivot is confirmed (requires right-side confirmation bars to pass)
Divergence is detected between current pivot and previous pivot
Total confluence score meets or exceeds your minimum threshold
Delay: Equal to your "Pivot Right Bars" setting (default 3 bars). This means signals appear 3 bars AFTER the actual pivot formed.
Use Case: Highest-quality, non-repainting signals for swing traders and learners who want to study confirmed pattern completion.
Tradeoff: Delayed signals. You will not receive the signal until confirmation occurs. In fast-moving markets, price may have already moved significantly by the time the signal appears.
Visual Behavior: Labels appear at the historical pivot location (in the past). Divergence lines connect the two pivots. This is the most educational mode because it shows completed, confirmed patterns.
Non-Repainting Guarantee: Yes. Once a signal appears, it never disappears or changes.
MODE 3: "Divergence + Confluence (Relaxed)"
How It Works: Same as Confirmed mode but with adaptive thresholds. If confluence is very high (10 points above threshold), the signal may appear even if some factors are weak. If divergence is present but confluence is slightly below threshold (within 10 points), it may still appear.
Delay: Same as Confirmed mode (right-side confirmation bars).
Use Case: Slightly more signals than Confirmed mode for traders willing to accept near-threshold setups.
Tradeoff: More signals but lower average quality than Confirmed mode.
Visual Behavior: Same as Confirmed mode.
DASHBOARD GUIDE - READING THE METRICS
The dashboard appears in the corner of your chart (position selectable in settings) and provides real-time market state analysis.
You can choose between four dashboard detail levels in settings: Off, Compact, Optimized (default), Full.
DASHBOARD ROW EXPLANATIONS
ROW 1 - Header Information
Left: Current symbol and timeframe
Center: "VMDM "
Right: Version number
ROW 2 - Mode and Delay
Shows which detection mode you are using and the signal delay.
Example: "CONFIRMED | Delay: 3 bars"
This reminds you that signals in confirmed mode appear 3 bars after the pivot forms.
ROW 3 - Market Regime
Format: "TREND UP HV" or "RANGING NV"
First Part - Trend State:
TREND UP: 20 EMA above 50 EMA with strong separation
TREND DOWN: 20 EMA below 50 EMA with strong separation
RANGING: EMAs close together, low trend strength
TRANSITION: Between trending and ranging states
Second Part - Volatility State:
HV: High Volatility (current ATR more than 1.3x the 50-bar average ATR)
NV: Normal Volatility (current ATR between 0.7x and 1.3x average)
LV: Low Volatility (current ATR less than 0.7x average)
Third Column: Volatility ratio (example: "1.45x" means current ATR is 1.45 times normal)
How To Use: Regime context helps you interpret signals. Reversal divergences are more reliable in ranging or transitional regimes. Continuation divergences (hidden) are more reliable in trending regimes. High volatility means wider stops may be needed.
ROW 4 - Pressure
Shows current volume pressure state.
Format: "BUYING | ██████████░░░░░░░░░"
States:
BUYING : Pressure strength above 60 (closes near highs)
SELLING : Pressure strength below 40 (closes near lows)
NEUTRAL : Pressure strength between 40-60
Bar Visualization: Each block represents 10 percentile points. A full bar (10 filled blocks) = 100th percentile pressure.
Color: Green for buying, red for selling, gray for neutral.
How To Use: When pressure aligns with divergence direction (bullish divergence during buying pressure), confluence is stronger.
ROW 5 - Volume and RSI
Format: "1.8x | RSI 68 | OB"
First Value: Current volume ratio (1.8x = volume is 1.8 times the moving average)
Second Value: Current RSI reading
Third Value: RSI state
OB: Overbought (RSI above 70)
OS: Oversold (RSI below 30)
Blank: Neutral RSI
How To Use: Volume spikes (above 1.5x) during divergence formation add confluence. RSI extremes at pivots add confluence.
ROW 6 - Behavioral Footprint
Format: "BULL HUNT | 2 bars"
Shows the most recent behavioral pattern detected and how long ago.
States:
ACCUMULATION / DISTRIBUTION: Absorption detected
BULL HUNT / BEAR HUNT: Stop hunt detected
SELL EXHAUST / BUY EXHAUST: Exhaustion detected
SCANNING: No recent pattern
NOW: Pattern is active on current bar
How To Use: When footprint activity is recent (within 50 bars) or active now, it adds context to divergence signals forming in that area.
ROW 7 - Current Pattern
Shows the divergence type currently detected (if any).
Examples: "BULLISH REGULAR", "BEARISH HIDDEN", "Scanning..."
Quality: Shows pattern quality (TEXTBOOK, HIGH QUALITY, VALID)
How To Use: This tells you what type of signal is active. Regular divergences are reversal setups. Hidden divergences are continuation setups.
ROW 8 - Session Summary
Format: "14 events | A3 H8 E3"
First Value: Total institutional events this session
Breakdown:
A: Absorption events
H: Stop hunt events
E: Exhaustion events
How To Use: High event counts suggest an active, volatile session with frequent structural anomalies. Low counts suggest quiet, orderly price action.
ROW 9 - Confluence Score (Optimized/Full mode only)
Format: "78/100 | ████████░░"
Shows current real-time confluence score even if no pattern is confirmed yet.
How To Use: Watch this in real-time to see how close you are to pattern formation. When it exceeds your threshold and divergence forms, a signal will appear (after confirmation delay).
ROW 10 - Patterns Studied (Optimized/Full mode only)
Format: "47 patterns | 12 bars ago"
First Value: Total confirmed patterns detected since chart loaded
Second Value: How many bars since the last confirmed pattern appeared
How To Use: Helps you understand pattern frequency on your selected symbol and timeframe. If many bars have passed since last pattern, market may be trending without reversal opportunities.
ROW 11 - Bull/Bear Ratio (Optimized/Full mode only)
Format: "28:19 | BULL"
Shows count of bullish vs bearish patterns detected.
Balance:
BULL: More bullish patterns detected (suggests market has had more bullish reversals/continuations)
BEAR: More bearish patterns detected
BAL: Equal counts
How To Use: Extreme imbalances can indicate directional bias in the studied period. A heavily bullish ratio in a downtrend might suggest frequent failed rallies (bearish continuation). Context matters.
ROW 12 - Volume Ratio Detail (Optimized/Full mode only)
Shows current volume vs average volume in absolute terms.
Example: "1.4x | 45230 / 32300"
How To Use: Confirms whether current activity is above or below normal.
ROW 13 - Last Institutional Event (Full mode only)
Shows the most recent institutional pattern type and how many bars ago it occurred.
Example: "DISTRIBUTION | 23 bars"
How To Use: Tracks recency of last anomaly for context.
SETTINGS GUIDE - EVERY PARAMETER EXPLAINED
PERFORMANCE SECTION
Enable All Visuals (Master Toggle)
Default: ON
What It Does: Master kill switch for ALL visual elements (labels, lines, boxes, background colors, dashboard). When OFF, only plot outputs remain (invisible unless you open data window).
When To Change: Turn OFF on mobile devices, 1-second charts, or slow computers to improve performance. You can still receive alerts even with visuals disabled.
Impact: Dramatic performance improvement when OFF, but you lose all visual feedback.
Maximum Object History
Default: 50 | Range: 10-100
What It Does: Limits how many of each object type (labels, lines, boxes) are kept in memory. Older objects beyond this limit are deleted.
When To Change: Lower to 20-30 on fast timeframes (1-minute charts) to prevent slowdown. Increase to 100 on daily charts if you want more historical pattern visibility.
Impact: Lower values = better performance but less historical visibility. Higher values = more history visible but potential slowdown on fast timeframes.
Alert Cooldown (Bars)
Default: 5 | Range: 1-50
What It Does: Minimum number of bars that must pass before another alert of the same type can fire. Prevents alert spam when multiple patterns form in quick succession.
When To Change: Increase to 20+ on 1-minute charts to reduce noise. Decrease to 1-2 on daily charts if you want every pattern alerted.
Impact: Higher cooldown = fewer alerts. Lower cooldown = more alerts.
USER EXPERIENCE SECTION
Show Enhanced Tooltips
Default: ON
What It Does: Enables detailed hover-over tooltips on labels and visual elements.
When To Change: Turn OFF if you encounter Pine Script compilation errors related to tooltip arguments (rare, platform-specific issue).
Impact: Minimal. Just adds helpful hover text.
MARKET STRUCTURE DETECTION SECTION
Pivot Left Bars
Default: 3 | Range: 2-10
What It Does: Number of bars to the LEFT of the center bar that must be higher (for pivot low) or lower (for pivot high) than the center bar for a pivot to be valid.
Example: With value 3, a pivot low requires the center bar's low to be lower than the 3 bars to its left.
When To Change:
Increase to 5-7 on noisy timeframes (1-minute charts) to filter insignificant pivots
Decrease to 2 on slow timeframes (daily charts) to catch more pivots
Impact: Higher values = fewer, more significant pivots = fewer signals. Lower values = more frequent pivots = more signals but more noise.
Pivot Right Bars
Default: 3 | Range: 2-10
What It Does: Number of bars to the RIGHT of the center bar that must pass for confirmation. This creates the non-repainting delay.
Example: With value 3, a pivot is confirmed 3 bars AFTER it forms.
When To Change:
Increase to 5-7 for slower, more confirmed signals (better for swing trading)
Decrease to 2 for faster signals (better for intraday, but still non-repainting)
Impact: Higher values = longer delay but more reliable confirmation. Lower values = faster signals but less confirmation. This setting directly controls your signal delay in Confirmed and Relaxed modes.
Minimum Confluence Score
Default: 60 | Range: 40-95
What It Does: The threshold score required for a pattern to be displayed. Patterns with confluence scores below this threshold are not shown.
When To Change:
Increase to 75+ if you only want high-quality textbook setups (fewer signals)
Decrease to 50-55 if you want to see more developing patterns (more signals, lower average quality)
Impact: This is your primary signal filter. Higher threshold = fewer, higher-quality signals. Lower threshold = more signals but includes weaker setups. Recommended starting point is 60-65.
TECHNICAL PERIODS SECTION
RSI Period
Default: 14 | Range: 5-50
What It Does: Lookback period for RSI calculation.
When To Change:
Decrease to 9-10 for faster, more sensitive RSI that detects shorter-term momentum changes
Increase to 21-28 for slower, smoother RSI that filters noise
Impact: Lower values make RSI more volatile (more frequent extremes and divergences). Higher values make RSI smoother (fewer but more significant divergences). 14 is industry standard.
Volume Moving Average Period
Default: 20 | Range: 10-200
What It Does: Lookback period for calculating average volume. Current volume is compared to this average to determine volume ratio.
When To Change:
Decrease to 10-14 for shorter-term volume comparison (more sensitive to recent volume changes)
Increase to 50-100 for longer-term volume comparison (smoother, less sensitive)
Impact: Lower values make volume ratio more volatile. Higher values make it more stable. 20 is standard.
ATR Period
Default: 14 | Range: 5-100
What It Does: Lookback period for Average True Range calculation used for volatility measurement and label positioning.
When To Change: Rarely needs adjustment. Use 7-10 for faster volatility response, 21-28 for slower.
Impact: Affects volatility ratio calculation and visual label spacing. Minimal impact on signals.
Pressure Percentile Lookback
Default: 50 | Range: 10-300
What It Does: Lookback period for calculating volume pressure percentile ranking. Your current pressure is ranked against the pressure of the last X bars.
When To Change:
Decrease to 20-30 for shorter-term pressure context (more responsive to recent changes)
Increase to 100-200 for longer-term pressure context (smoother rankings)
Impact: Lower values make pressure strength more sensitive to recent bars. Higher values provide more stable, long-term pressure assessment. Capped at 300 for performance reasons.
SIGNAL DETECTION SECTION
Signal Detection Mode
Default: "Divergence + Confluence (Confirmed)"
Options:
Confluence Only (Real-time)
Divergence + Confluence (Confirmed)
Divergence + Confluence (Relaxed)
What It Does: Selects which detection logic mode to use (see "Understanding The Three Detection Modes" section above).
When To Change: Use Confirmed for learning and non-repainting signals. Use Real-time for live scanning without divergence requirement. Use Relaxed for slightly more signals than Confirmed.
Impact: Fundamentally changes when and how signals appear.
VISUAL LAYERS SECTION
All toggles default to ON. Each controls visibility of one visual layer:
Show Market Structure: Pivot markers and support/resistance lines
Show Pressure Zones: Background color shading
Show Divergence Lines: Dotted lines connecting pivots
Show Institutional Footprint Markers: Absorption boxes, hunt labels, exhaustion labels
Show Consolidated Analysis Label: Main pattern detection label
Use Compact Label Format
Default: OFF
What It Does: Switches consolidated label between single-line compact format and multi-line detailed format.
When To Change: Turn ON if you find full labels too large or distracting.
Impact: Visual clarity vs. information density tradeoff.
DASHBOARD SECTION
Dashboard Mode
Default: "Optimized"
Options: Off, Compact, Optimized, Full
What It Does: Controls how much information the dashboard displays.
Off: No dashboard
Compact: 8 rows (essential metrics only)
Optimized: 12 rows (recommended balance)
Full: 13 rows (every available metric)
Dashboard Position
Default: "Top Right"
Options: Top Right, Top Left, Bottom Right, Bottom Left
What It Does: Screen corner where dashboard appears.
HOW TO USE VMDM - PRACTICAL WORKFLOW
STEP 1 - INITIAL SETUP
Add VMDM to your chart
Select your detection mode (Confirmed recommended for learning)
Set your minimum confluence score (start with 60-65)
Adjust pivot parameters if needed (default 3/3 is good for most timeframes)
Enable the visual layers you want to see
STEP 2 - CHART ANALYSIS
Let the indicator load and analyze historical data
Review the patterns that appear historically
Examine the confluence scores - notice which patterns had higher scores
Observe which patterns occurred during supportive pressure zones
Notice the divergence line connections - understand what price vs RSI did
STEP 3 - PATTERN RECOGNITION LEARNING
When a consolidated analysis label appears:
Read the divergence type (regular or hidden, bullish or bearish)
Check the quality tier (textbook, high quality, or valid)
Review the confluence breakdown - which factors contributed
Look at the chart context - where is price relative to structure, trend, etc.
Observe the behavioral footprint markers nearby - do they support the pattern
STEP 4 - REAL-TIME MONITORING
Watch the dashboard for real-time regime and pressure state
Monitor the current confluence score in the dashboard
When it approaches your threshold, be alert for potential pattern formation
When a new pattern appears (after confirmation delay), evaluate it using the workflow above
Use your trading strategy rules to decide if the setup aligns with your criteria
STEP 5 - POST-PATTERN OBSERVATION
After a pattern appears:
Mark the level on your chart
Observe what price does after the pattern completes
Did price respect the reversal/continuation signal
What was the confluence score of patterns that worked vs. those that failed
Learn which quality tiers and confluence levels produce better results on your specific symbol and timeframe
RECOMMENDED TIMEFRAMES AND ASSET CLASSES
VMDM is timeframe-agnostic and works on any asset with volume data. However, optimal performance varies:
BEST TIMEFRAMES
15-Minute to 1-Hour: Ideal balance of signal frequency and reliability. Pivot confirmation delay is acceptable. Sufficient volume data for pressure analysis.
4-Hour to Daily: Excellent for swing trading. Very high-quality signals. Lower frequency but higher significance. Recommended for learning because patterns are clearer.
1-Minute to 5-Minute: Works but requires adjustment. Increase pivot bars to 5-7 for filtering. Decrease max object history to 30 for performance. Expect more noise.
Weekly/Monthly: Works but very infrequent signals. Increase confluence threshold to 70+ to ensure only major patterns appear.
BEST ASSET CLASSES
Forex Majors: Excellent volume data and clear trends. Pressure analysis works well.
Crypto (Major Pairs): Good volume data. High volatility makes divergences more pronounced. Works very well.
Stock Indices (SPY, QQQ, etc.): Excellent. Clean price action and reliable volume.
Individual Stocks: Works well on high-volume stocks. Low-volume stocks may produce unreliable pressure readings.
Commodities (Gold, Oil, etc.): Works well. Clear trends and reactions.
WHAT THIS INDICATOR CANNOT DO - LIMITATIONS
LIMITATION 1 - It Does Not Predict The Future
VMDM identifies when technical conditions align historically associated with potential reversals or continuations. It does not predict what will happen next. A textbook 95-confluence pattern can still fail if fundamental events, news, or larger timeframe structure override the setup.
LIMITATION 2 - Confirmation Delay Means You Miss Early Entry
In Confirmed and Relaxed modes, the non-repainting design means you receive signals AFTER the pivot is confirmed. Price may have already moved significantly by the time you receive the signal. This is the tradeoff for non-repainting reliability. You can use Real-time mode for faster signals but sacrifice divergence confirmation.
LIMITATION 3 - It Does Not Tell You Position Sizing or Risk Management
VMDM provides technical pattern analysis. It does not calculate stop loss levels, take profit targets, or position sizing. You must apply your own risk management rules. Never risk more than you can afford to lose based on a technical signal.
LIMITATION 4 - Volume Pressure Analysis Requires Reliable Volume Data
On assets with thin volume or unreliable volume reporting, pressure analysis may be inaccurate. Stick to major liquid assets with consistent volume data.
LIMITATION 5 - It Cannot Detect Fundamental Events
VMDM is purely technical. It cannot predict earnings reports, central bank decisions, geopolitical events, or other fundamental catalysts that can override technical patterns.
LIMITATION 6 - Divergence Requires Two Pivots
The indicator cannot detect divergence until at least two pivots of the same type have formed. In strong trends without pullbacks, you may go long periods without signals.
LIMITATION 7 - Institutional Pattern Names Are Interpretive
The behavioral footprint patterns are named using common trading education terminology, but they are detected through technical analysis, not actual institutional data access. The patterns are interpretations based on price and volume behavior.
CONCEPT FOUNDATION - WHY THIS APPROACH WORKS
MARKET PRINCIPLE 1 - Momentum Divergence Precedes Price Reversal
Price is the final output of market forces, but momentum (the rate of change in those forces) shifts first. When price makes a new low but the momentum behind that move is weaker (higher RSI low), it signals that sellers are losing strength even though they temporarily pushed price lower. This precedes reversal. This is a fundamental principle in technical analysis taught by Charles Dow, widely observed in market behavior.
MARKET PRINCIPLE 2 - Volume Reveals Conviction
Price can move on low volume (low conviction) or high volume (high conviction). When price makes a new low on declining volume while RSI shows improving momentum, it suggests the new low is not confirmed by participant conviction. Adding volume pressure analysis to momentum divergence adds a confirmation layer that filters false divergences.
MARKET PRINCIPLE 3 - Anomalies Mark Structural Extremes
When volume spikes significantly but range contracts (absorption), or when price spikes beyond structure then reverses (stop hunt), or when aggressive moves are met with large-wick rejection (exhaustion), these anomalies often mark short-term extremes. Combining these structural observations with momentum analysis creates context.
MARKET PRINCIPLE 4 - Confluence Improves Probability
No single technical factor is reliable in isolation. RSI divergence alone fails frequently. Volume analysis alone cannot time entries. Combining multiple independent factors into a weighted system increases the probability that observed patterns have structural significance rather than random noise.
THE EDUCATIONAL VALUE
By visualizing all four layers simultaneously and breaking down the confluence scoring transparently, VMDM teaches you to think in terms of multi-dimensional analysis rather than single-indicator reliance. Over time, you will learn to recognize these patterns manually and understand which combinations produce better results on your traded assets.
INSTITUTIONAL TERMINOLOGY - IMPORTANT CLARIFICATION
This indicator uses the following terms that are common in trading education:
Institutional Footprint
Absorption (Accumulation / Distribution)
Stop Hunt
Exhaustion
CRITICAL DISCLAIMER:
These terms are EDUCATIONAL LABELS for specific price action and volume behavior patterns detected through technical analysis of publicly available chart data (open, high, low, close, volume). This indicator does NOT have access to:
Actual institutional order flow or order book data
Market maker positions or intentions
Broker stop-loss databases
Non-public trading data
Proprietary institutional information
The patterns labeled as "institutional footprint" are interpretations based on observable price and volume behavior that educational trading literature often associates with potential large-participant activity. The detection is algorithmic pattern recognition, not privileged data access.
When this indicator identifies "absorption," it means it detected high volume within a small range - a condition that MAY indicate large orders being filled but is not confirmation of actual institutional participation.
When it identifies a "stop hunt," it means price briefly penetrated a structural level then reversed - a pattern that MAY have triggered stop losses but is not confirmation that stops were specifically targeted.
When it identifies "exhaustion," it means high volume with large rejection wicks - a pattern that MAY indicate aggressive participation meeting strong opposition but is not confirmation of institutional involvement.
These are technical analysis interpretations, not factual statements about market participant identity or intent.
DISCLAIMER AND RISK WARNING
EDUCATIONAL PURPOSE ONLY
This indicator is designed as an educational tool to help traders learn to recognize technical patterns, understand multi-factor analysis, and practice systematic market observation. It is NOT a trading system, signal service, or financial advice.
NO PERFORMANCE GUARANTEE
Past pattern behavior does not guarantee future results. A pattern that historically preceded price movement in one direction may fail in the future due to changing market conditions, fundamental events, or random variance. Confluence scores reflect historical technical alignment, not future certainty.
TRADING INVOLVES SUBSTANTIAL RISK
Trading financial instruments involves substantial risk of loss. You can lose more than your initial investment. Never trade with money you cannot afford to lose. Always use proper risk management including stop losses, position sizing, and portfolio diversification.
NO PREDICTIVE CLAIMS
This indicator does NOT predict future price movement. It identifies when technical conditions align in patterns that historically have been associated with potential reversals or continuations. Market behavior is probabilistic, not deterministic.
BACKTESTING LIMITATIONS
If you backtest trading strategies using this indicator, ensure you account for:
Realistic commission costs
Realistic slippage (difference between signal price and actual fill price)
Sufficient sample size (minimum 100 trades for statistical relevance)
Reasonable position sizing (risking no more than 1-2 percent of account per trade)
The confirmation delay inherent in the indicator (you cannot enter at the exact pivot in Confirmed mode)
Backtests that do not account for these factors will produce unrealistic results.
AUTHOR LIABILITY
The author (BullByte) is not responsible for any trading losses incurred using this indicator. By using this indicator, you acknowledge that all trading decisions are your sole responsibility and that you understand the risks involved.
NOT FINANCIAL ADVICE
Nothing in this indicator, its code, its description, or its visual outputs constitutes financial, investment, or trading advice. Consult a licensed financial advisor before making investment decisions.
FREQUENTLY ASKED QUESTIONS
Q: Why do signals appear in the past, not at the current bar
A: In Confirmed and Relaxed modes, signals appear at confirmed pivots, which requires waiting for right-side confirmation bars (default 3). This creates a delay but prevents repainting. Use Real-time mode if you want current-bar signals without pivot confirmation.
Q: Can I use this for automated trading
A: You can create alert-based automation, but understand that Confirmed mode signals appear AFTER the pivot with delay, so your entry will not be at the pivot price. Real-time mode signals can change as the current bar develops. Automation requires careful consideration of these factors.
Q: How do I know which confluence score to use
A: Start with 60. Observe which patterns work on your symbol/timeframe. If too many false signals, increase to 70-75. If too few signals, decrease to 55. Quality vs. quantity tradeoff.
Q: Do regular divergences mean I should enter a reversal trade immediately
A: No. Regular divergences indicate momentum exhaustion, which is a WARNING sign that trend may reverse, not a confirmation that it will. Use confluence score, market context, support/resistance, and your strategy rules to make entry decisions. Many divergences fail.
Q: What's the difference between regular and hidden divergence
A: Regular divergence = price and momentum move in opposite directions at extremes = potential reversal signal. Hidden divergence = price and momentum move in opposite directions during pullbacks = potential continuation signal. Hidden divergence suggests the pullback is just a correction within the larger trend.
Q: Why does the pressure zone color sometimes conflict with the divergence direction
A: Pressure is real-time current bar analysis. Divergence is confirmed pivot analysis from the past. They measure different things at different times. A bullish divergence confirmed 3 bars ago might appear during current selling pressure. This is normal.
Q: Can I use this on stocks without volume data
A: No. Volume is required for pressure analysis and behavioral pattern detection. Use only on assets with reliable volume reporting.
Q: How often should I expect signals
A: Depends on timeframe and settings. Daily charts might produce 5-10 signals per month. 1-hour charts might produce 20-30. 15-minute charts might produce 50-100. Adjust confluence threshold to control frequency.
Q: Can I modify the code
A: Yes, this is open source. You can modify for personal use. If you publish a modified version, please credit the original and ensure your publication meets TradingView guidelines.
Q: What if I disagree with a pattern's confluence score
A: The scoring weights are based on general observations and may not suit your specific strategy or asset. You can modify the code to adjust weights if you have data-driven reasons to do so.
Final Notes
VMDM - Volume, Momentum and Divergence Master is an educational multi-layer market analysis system designed to teach systematic pattern recognition through transparent, confluence-weighted signal detection. By combining RSI momentum divergence, volume pressure quantification, behavioral footprint pattern recognition, and quality scoring into a unified framework, it provides a comprehensive learning environment for understanding market structure.
Use this tool to develop your analytical skills, understand how multiple technical factors interact, and learn to distinguish high-quality setups from noise. Remember that technical analysis is probabilistic, not predictive. No indicator replaces proper education, risk management, and trading discipline.
Trade responsibly. Learn continuously. Risk only what you can afford to lose.
-BullByte

ICT Smart Money Trading Suite PRO [SwissAlgo]ICT SMC Trading Suite Pro
Structure Detection. Imbalance Tracking. Trade Planning. Contextual Alerts.
Why This Integrated System Was Built
The ICT/SMC methodology requires tracking multiple analytical components simultaneously - a process prone to manual errors, time inefficiency, and visual clutter . This indicator consolidates these elements into a single, unified system , providing rules-based validation for experienced ICT traders who may struggle with execution speed, consistency, and manual calculations.
-----------------------------------------------------------------
What This Indicator Does
ICT/SMC methodology involves tracking multiple analytical components simultaneously. This indicator consolidates them into a single system.
Common challenges when applying ICT manually:
1️⃣ Structure Identification
Determining which pivots qualify as external (macro) structure versus internal (micro) structure requires consistent rules. Inconsistent structure identification affects the detection of the relevant trading range for entries , Change of Character (ChoCH) , and Break of Structure (BoS) . Accurate structure identification is paramount ; a faulty reading invalidates the entire ICT thesis for the current swing. While no automated system can replace human judgment, the indicator provides you with a rules-based starting point for structural analysis. The key goal is to help you find and map the relevant structural leg to focus on.
2️⃣ Chart Organization
Drawing Fibonacci retracements, Fair Value Gaps, Order Blocks, and other imbalances manually creates visual complexity that can obscure the analysis. The indicator addresses this by striving to show all imbalances in a consistent, unified, and understandable visual way , using color coding and z-order layering to maintain clarity even when multiple components are active.
3️⃣ Imbalance Tracking
ICT methodology requires monitoring a vast array of institutional footprints : Fair Value Gaps (FVG), Order Blocks (OB), Breaker Blocks (BB), Liquidity Pools (LP), Volume Imbalances, Wick Imbalances, and Kill Zone ranges. Tracking all these simultaneously and manually monitoring their mitigation status is highly time-intensive and prone to oversight . The indicator constantly scans and tracks all key imbalance types for you, automatically updating their status and creating a dynamic, real-time visual heatmap of unmitigated institutional inefficiency.
4️⃣ Trade Calculation
Determining structure-based Stop Loss (SL) placement, calculating multiple Take Profit (TP) levels with accurate position-sizing splits, and computing the final blended Risk-to-Reward (R:R) ratio involves multiple time-sensitive, manual calculations per setup . The indicator automates this entire trade calculation process for you, instantly providing the necessary pricing (entry, SL, TP), sizing, and performance projections, and mitigating the risk of execution error .
5️⃣ Condition Monitoring
ICT setups often require specific technical conditions to align: price reaching discount Fibonacci levels (0.618-0.882 for shorts, 0.118-0.382 for longs), EMA crossovers confirming momentum, or structural shifts (ChoCH/BoS). Identifying these moments requires continuous chart observation across multiple assets and timeframes.
This indicator includes an alert system that monitors these technical conditions and sends notifications when they occur (real-time). The alert system is designed to minimize spam. This allows traders to review potential setups on demand rather than through continuous observation - particularly relevant for those monitoring multiple instruments or trading sessions outside their local timezone.
-----------------------------------------------------------------
Intended Use
This indicator is designed for traders who:
♦ Apply ICT/SMC methodology - Familiarity with concepts such as Fair Value Gaps, Order Blocks, Liquidity Pools, market structure, and discount/premium zones is assumed. The indicator does not teach these concepts but provides tools to apply them.
♦ Trade on intraday to swing timeframes - The structure detection and Fibonacci zone mapping work across multiple timeframes. Recommended primary timeframe: 1H (adjustable based on trading approach).
♦ Prefer systematic entry planning - The trade calculation feature computes stop loss, take profit levels, and risk-to-reward ratios based on structure and Fibonacci positioning. Suitable for traders who use defined entry criteria.
♦ Monitor multiple instruments or sessions - The alert functionality notifies when specific technical conditions occur (discount zone entries, EMA crossovers, structure changes), reducing the need for continuous manual monitoring.
♦ Use trade execution platforms - The trade summary table displays pre-formatted values (entry, SL, TP levels with quantity splits) that can be manually input into trading platforms or bot services like 3Commas.
-----------------------------------------------------------------
How To Use
Step 1: Structure Analysis
The indicator automatically detects external and internal market structure using pivot analysis. Structure lines are color-coded: red for bearish structure, green for bullish. External pivots are marked with larger triangles, internal pivots with smaller markers. The pivot length parameters (default: 20/20) can be adjusted in settings to align with your structural analysis approach and the asset you are analyzing.
Step 2: Define Your Trading Zone
Use the "Start Swing" and "End Swing" date inputs to mark the beginning and end of the (external) structural leg you wish to analyze. The indicator calculates Fibonacci retracement levels based on these points and color-codes the zones:
* Green zones: Discount area (0.618-0.882 for bearish / 0.118-0.382 for bullish)
* Yellow zones: Premium area (0.786-1.0 for bearish / 0.0-0.214 for bullish)
* Red zones: Extension area beyond structure (potential fake-out zones)
Step 3: Review Imbalances
The indicator identifies and displays multiple imbalance types:
🔥 Volume imbalances (from displacement candles based on PVSRA methodology)
🔥 Fair Value Gaps (FVG)
🔥 Order Blocks (OB) and Breaker Blocks (BB)
🔥 Liquidity Pools (LP) at equal highs/lows
🔥 Wick imbalances (exceptional wick formations)
🔥 Kill Zone liquidity from specific trading sessions (Asian, London, NY AM)
Volume Imbalances
Fair Value Gaps
Order Blocks
Liquidity Pools
Wick Imbalances
Kill Zone Imbalances
According to ICT methodology, imbalances act as price magnets - areas where price tends to return for mitigation. When multiple imbalances overlap at the same price level, this creates a confluence zone with a higher probability of price reaction .
Imbalances are displayed as gray boxes , creating a visual heatmap of institutional inefficiencies. When imbalances overlap, the zones appear darker due to layering, and labels combine to show confluence (e.g., "FVG + OB" or "Vol + LP").
Heatmap of Imbalances
User can view each type alone, or all together (heatmap)
Each imbalance type is tracked until mitigated by price according to ICT principles and can be toggled on/off independently in settings.
Step 4: Reference Levels & Sessions
The indicator displays additional reference data:
🔥 Daily Pivot Points (PP, R1-R3, S1-S3) calculated from previous day
🔥Average Daily Range (ADR) projected from the current day's extremes
🔥 Daily OHLC levels: Today's Open (DO), Previous Day High (PDH), Previous Day Low (PDL)
🔥Session backgrounds (optional): Color-coded boxes for Asian, London, NY AM, and NY PM sessions
Sessions
While these are not ICT-specific imbalances, they represent widely-watched price levels that often attract institutional activity and can act as additional reference points for support, resistance, and liquidity targeting.
All reference levels can be toggled independently in settings.
Step 5: Momentum Reference
EMA 14 and EMA 21 lines are displayed for momentum analysis. When EMA 14 enters discount zones and crosses EMA 21, a triangle marker appears on the chart. This indicates a potential alignment of structure and momentum conditions.
Step 6: Trade Planning
Input your intended entry price in the "Entry Price" field along with your margin and leverage parameters. The indicator automatically calculates all trade parameters:
* Stop loss level (based on Fibonacci structure - typically at 1.118 extension)
* Three take profit levels (TP1, TP2, TP3) with position quantity splits
* Risk-to-reward ratio (blended across all three targets)
* Projected profit/loss values in both dollars and percentage
All calculated values are displayed both visually on the chart (as horizontal lines with labels) and in a formatted Trade Summary table. The table organizes the information for quick reference: entry details, take profit levels with quantities, stop loss parameters, and performance projections.
This pre-calculated data can be manually copied into trading platforms or bot services (such as 3Commas Smart Trades) without requiring additional calculations.
Step 7: Alert Configuration
Create alerts using TradingView's alert system (select "Any alert() function call"). The indicator sends notifications when:
* Price reaches specific discount Fibonacci levels (0.618, 0.786, 0.882 for shorts / 0.382, 0.214, 0.118 for longs)
* EMA 14/21 crossovers occur within discount zones
* Change of Character (ChoCH) is detected
* Break of Structure (BoS) is detected
Note: Alerts require active TradingView alert functionality. Update alerts when changing your trading zone parameters.
-----------------------------------------------------------------
Key Features
Structure & Zone Analysis
* Automated structure detection with external/internal pivots and zig-zag visualization
* Fibonacci retracement mapping with color-coded discount/premium zones
* Visual zone classification: Green (optimal discount), Yellow (premium), Red (fake-out risk)
ICT Imbalances Heatmap
* Volume imbalances (PVSRA displacement candles)
* Fair Value Gaps (FVG)
* Order Blocks (OB) and Breaker Blocks (BB)
* Liquidity Pools (LP) at equal highs/lows
* Wick imbalances (exceptional wick formations)
* Kill Zone liquidity (Asian, London, NY AM sessions)
* Confluence detection with combined labels and visual layering
Reference Levels
* Daily Pivot Points (PP, R1-R3, S1-S3)
* Average Daily Range (ADR) projections
* Daily OHLC levels (DO, PDH, PDL)
* Session backgrounds for kill zones
Trade Planning Tools
* Automated stop loss calculation based on Fibonacci structure
* Three-tier take profit system with position quantity splits
* Risk-to-reward ratio calculation (blended across all targets)
* P&L projections in dollars and percentages
* Trade Summary table formatted for manual platform entry
Momentum & Signals
* EMA 14/21 overlay for momentum analysis
* Visual crossover markers (triangles) in discount zones
* Change of Character (ChoCH) detection and labels
* Break of Structure (BoS) detection and labels
Chart Enhancements
* Higher timeframe candle overlay (5m to Monthly)
* PVSRA candle coloring (volume-based)
* Symbol legend for quick reference
* Customizable visual elements (toggle all components independently)
Alert System
* Discount zone entry notifications (Fibonacci level monitoring)
* EMA crossover signals within discount zones
* Structure change alerts (ChoCH and BoS)
* Configurable via TradingView alert functionality
Alert Functionality
The indicator includes an alert system that monitors technical conditions continuously.
When configured, alerts notify users when specific events occur:
❗ Discount Zone Monitoring
When EMA 14 crosses into key Fibonacci levels (0.618, 0.786, 0.882 for bearish structure / 0.382, 0.214, 0.118 for bullish structure), an alert is triggered. Example: Trading BTC and ETH simultaneously - instead of monitoring both charts for zone entries, alerts notify when either asset reaches the specified level.
❗ Momentum Alignment
When EMA 14 crosses EMA 21 within discount zones, an alert is sent. Example: Monitoring setups across multiple timeframes (1H, 4H, Daily) - alerts indicate when momentum conditions align on any timeframe being tracked.
❗ Structure Changes
Change of Character (ChoCH) and Break of Structure (BoS) events trigger alerts. Example: Trading during the Asian session while located in a different timezone - alerts notify of structure changes occurring outside active monitoring hours.
Configuration
Alerts are set up through TradingView's native alert system. Select "Any alert() function call" when creating the alert.
⚠️ Note: Alert parameters are captured at creation time, so alerts must be updated when changing trading zone settings (Start/End Swing dates) or any other parameter.
How to Create Alerts
Step 1: Open Alert Creation
Click the "Alert" button (clock icon) in the top toolbar of TradingView, or right-click on the chart and select "Add Alert."
Step 2: Configure Alert Condition
* In the alert dialog, set the Condition dropdown to select this indicator
* Set the alert type to ⚠️ " Any alert() function call "
* This configuration allows the indicator to trigger alerts based on its internal logic
Step 3: Set Alert Timing
* Timeframe: Same as chart
* Expiration: Choose "Open-ended (when triggered)" to keep the alert active until conditions occur
* Message tab: choose a name for the alert
Step 4: Notification Settings
Configure how you want to receive notifications:
* Popup within TradingView
* Email notification
* Mobile app push notification (requires TradingView mobile app)
Step 5: Create
Important Notes:
* Alert parameters are captured at creation time . If you change your trading zone (Start/End Swing dates) or entry price, delete the old alert and create a new one .
* One alert per chart: Create separate alerts for each instrument and timeframe you're monitoring.
* TradingView alert limits apply based on your TradingView subscription tier.
What Triggers Alerts: This indicator sends alerts for four key event types:
1. Discount Zone Entry - EMA 14 crossing key Fibonacci levels
2. Momentum Crossover - EMA 14/21 crossovers within discount zones
3. Change of Character (ChoCH) - Structure reversal detected
4. Break of Structure (BoS) - Trend continuation confirmed
All four conditions are monitored by a single alert configuration .
-----------------------------------------------------------------
Recommended Settings
* Timeframe : 1H works well for most assets
* Theme : Dark mode recommended
* Structural Pivots : Default 20/20 captures reasonable structure; adjust to match your analysis
-----------------------------------------------------------------
Chart Elements Guide
♦ Structure Visualization
Zig-zag lines
Automated structure detection - green lines indicate bullish structure, red lines indicate bearish structure. Thick lines represent external structure , thin faded lines show internal structure .
Triangle markers
Large triangles mark external pivots (swing highs/lows), small triangles mark internal pivots.
Fibonacci Zones
* Green zones: Discount area - potential entry zones (0.618-0.882 for shorts / 0.118-0.382 for longs)
* Yellow zones: Premium area - higher extension zones (0.786-1.0 for shorts / 0.0-0.214 for longs)
* Red zones: Fake-out risk area - price beyond structural extremes (above 1.0 for shorts / below 0.0 for longs)
* White dashed lines: Individual Fibonacci levels (1.0, 0.882, 0.786, 0.618, 0.5, 0.382, 0.214, 0.118, 0.0)
♦ Imbalance Heatmap
Gray boxes with dotted midlines
Unmitigated imbalances create a visual heatmap. Overlapping imbalances appear darker due to layering.
Combined labels
When multiple imbalances overlap, labels show confluence (e.g., "FVG + OB", "Vol + LP + Wick")
Types displayed : Vol (Volume), FVG (Fair Value Gap), OB (Order Block), BB (Breaker Block), LP (Liquidity Pool), Wick, KZ (Kill Zone)
♦ Momentum Indicators
* Red line: EMA 14
* Yellow line: EMA 21
* Small triangles on price: Crossover signals - red triangle (bearish crossover), green triangle (bullish crossover) when occurring within discount zones
♦ Structure Change Markers
* Labels with checkmarks/crosses: ChoCH (Change of Character) and BoS (Break of Structure) events (Green label with ✓: Bullish ChoCH or BoS, Red label with ✗: Bearish ChoCH or BoS)
♦ Trade Planning Lines (when entry price is set)
* Blue horizontal line: Entry price
* Green dashed lines: TP1 and TP2
* Green solid line: TP3 (final target)
* Red horizontal line: Stop Loss level
TP levels and SL are calculated based on the structure range, entry price, and mapped trading zone, and aim to achieve a minimum risk: reward ratio of 1:1.5 (R:R)
♦ Colored background zones:
Green shading between entry and TP3 (profit zone), red shading between entry and SL (loss zone)
♦ Reference Levels
* Orange dotted lines with labels: Daily Pivot Points (PP, R1-R3, S1-S3)
* Purple dotted lines with labels: ADR High and ADR Low projections
* Cyan dotted lines with labels: DO (Daily Open), PDH (Previous Day High), PDL (Previous Day Low)
♦ Session Backgrounds (optional)
* Yellow shaded box: Asian session (19:00-00:00 NY time)
* Blue shaded box: London session (02:00-05:00 NY time)
* Green shaded box: NY AM session (09:30-11:00 NY time)
* Orange shaded box: NY PM session (13:30-16:00 NY time)
♦ Trade Summary Table (top-right corner)
Displays a complete trade plan with sections:
* Sanity Check: Plan validation status
* Setup: Trade type, leverage, entry price, position size
* Take Profit: TP1, TP2, TP3 with prices, percentages, and quantity splits
* Stop Loss: SL price and type
* Performance: Potential profit/loss, ROI, and risk-to-reward ratio
♦ HTF Candle Overlay (optional, displayed to the right of the current price)
* Larger candlesticks representing higher timeframe price action
* Green bodies: Bullish HTF candles
* Red bodies: Bearish HTF candles
* Label shows selected timeframe (e.g., "HTF→ D" for daily)
♦ Legend Table (bottom-right corner)
Quick reference guide explaining all symbol abbreviations and color codes used on the chart.
-----------------------------------------------------------------
Methodology & Calculation Details
This indicator consolidates multiple ICT/SMC analytical components into a single integrated system. While individual elements could be created separately, this integration provides automated coordination between components , consistency, and reduces chart complexity.
Structure Detection External and internal pivots
Are identified using fractal pivot analysis with configurable lookback periods (default: 20 bars for both). A pivot high is confirmed when the high at the pivot bar exceeds all highs within the lookback range on both sides. Pivot lows use inverse logic. Structure lines connect validated pivots, with color coding based on price direction (higher highs/higher lows = bullish, lower highs/lower lows = bearish).
Fibonacci Retracement Calculation
Users define two swing points via date/time inputs. The indicator calculates the price range between these points and applies standard Fibonacci ratios (0.0, 0.118, 0.214, 0.382, 0.5, 0.618, 0.786, 0.882, 1.0, plus extensions at 1.118, 1.272, -0.118, -0.272). Zone classification is based on ICT discount/premium principles: 0.618-1.0 range for bearish setups, 0.0-0.382 for bullish setups.
Imbalance Identification
Volume Imbalances : Detected using PVSRA (Price, Volume, Support, Resistance Analysis) methodology. Candles are classified based on the percentile ranking of volume and price range over a 1344-bar lookback period. Type 1 imbalances require ≥95th percentile in both volume and range; Type 2 requires ≥85th percentile. Additional filters include body-to-range ratio (≥50% for Type 1, ≥30% for Type 2) and ATR validation.
Fair Value Gaps (FVG) : Identified when a three-candle sequence shows a price gap: low > high for bullish FVG, high < low for bearish FVG. The middle candle must close beyond the gap edge. Mitigation occurs when the price retraces into the gap.
Order Blocks (OB) : Detected by identifying the last opposing candle before a significant price move. When price breaks a swing high/low, the algorithm scans backwards to find the candle with the highest high (bearish OB) or lowest low (bullish OB) before the breakout. When an OB is breached, it converts to a Breaker Block (BB).
Liquidity Pools (LP) : Identified by detecting equal highs or equal lows using a tolerance threshold based on ATR. Pivot highs/lows within this tolerance range are grouped. Equal highs create Buy-Side Liquidity (BSL) zones above the level; equal lows create Sell-Side Liquidity (SSL) zones below the level.
Wick Imbalances: Flagged when a candle's wick exceeds 1.0x ATR and comprises >50% of the total candle range. These represent rapid rejections or absorption events.
Kill Zone Liquidity: Tracks the high/low range during specific ICT-defined sessions (Asian: 19:00-00:00 NY, London: 02:00-05:00 NY, NY AM: 09:30-11:00 NY). At session close, BSL and SSL zones are created above/below the session range.
Change of Character (ChoCH) & Break of Structure (BoS)
ChoCH is detected when price breaks counter to the established structure (bearish structure broken upward = bullish ChoCH; bullish structure broken downward = bearish ChoCH). BoS occurs when price breaks in the direction of the established trend (bearish structure breaking lower = bearish BoS; bullish structure breaking higher = bullish BoS).
Trade Calculations
Stop Loss and Take Profit levels are calculated based on the entry position within the Fibonacci zone structure:
* Premium entries (0.786-1.0 for shorts / 0.0-0.214 for longs): SL at 1.118/-0.118 extension, TP structure weighted toward zone extremes
* Golden entries (0.618-0.786 for shorts / 0.214-0.382 for longs): SL at 1.0/0.0 boundary, TP structure balanced across range
Risk-to-reward ratios are calculated as blended values across all three take profit levels, weighted by position quantity splits.
Reference Level Calculations
* Pivot Points: Standard formula using previous day's high, low, and close: PP = (H + L + C) / 3
* Support/Resistance: R1 = 2×PP - L, S1 = 2×PP - H, with R2/S2 and R3/S3 calculated using range extensions
* ADR: 14-period simple moving average of daily high-low range, projected from current day's extremes
Momentum Analysis
EMA 14 and EMA 21 use standard exponential moving average calculations. Crossovers are detected when EMA 14 crosses EMA 21 within user-defined discount zones, with directional confirmation (cross under in bearish discount = short signal; cross over in bullish discount = long signal).
Why This Integration Matters
While components like EMA crossovers, pivot detection, or Fibonacci retracements exist as separate indicators, this system provides:
1. Coordinated Analysis : All components reference the same structural framework (user-defined trading zone)
2. Automated Mitigation Tracking : Imbalances are monitored continuously and removed when mitigated according to ICT principles
3. Contextual Alerts : Notifications are triggered only when conditions align within the defined structural context
4. Trade Parameter Automation : Stop loss and take profit calculations adjust dynamically based on entry positioning within the structure
5. Consistent Visual Display : All elements use a unified color scheme, labeling system, and z-order layering. This eliminates visual conflicts that occur when stacking multiple independent indicators (overlapping lines, label collisions, inconsistent transparency levels, conflicting color schemes).
This consolidation reduces the need to manually coordinate 8-10 separate indicators, eliminates redundant calculations across disconnected tools, and maintains visual clarity even when all components are displayed simultaneously.
-----------------------------------------------------------------
Disclaimer
1. Indicator Functionality and Purpose
This indicator is solely a technical analysis tool built upon established methodologies (Smart Money Concepts/ICT) and statistical calculations (Pivots, Fibonacci, EMAs). It is designed to assist experienced traders in visualizing complex data, streamlining the analytical workflow, and automating conditional alerting.
The indicator is NOT:
♦ Financial Advice: It does not provide personalized investment recommendations, solicited advice, or instruction on buying, selling, or holding any financial instrument.
♦ A Guarantee of Profit: The presence of a signal, alert, or trade plan output by this tool does not guarantee that any trade will be profitable.
♦ A Predictor of Future Prices: The tool calculates probabilities and potential scenarios based on historical data and current structure; it does not predict future market movements.
2. General Trading Risks and Capital Loss
♦ All trading involves substantial risk of loss. You may lose some or all of your initial capital. Leveraged products, such as futures, CFDs, and margin trading, carry a high degree of risk and are not suitable for all investors.
♦ Risk Acknowledgment: By using this indicator, you acknowledge and accept that you are solely responsible for all trading decisions, and you bear the full risk of any resulting profit or loss.
♦ Risk Management is Crucial: This indicator is an analytical tool only. You must employ independent risk management techniques (position sizing, stop-loss orders) tailored to your personal financial situation and risk tolerance.
3. Calculation Limitations and Non-Real-Time Data
The calculations performed by this indicator are based on the data provided by your charting platform (e.g., TradingView).
♦ Data Accuracy: The accuracy of the outputs (e.g., Price Delivery Arrays, Pivots, P&L projections) is dependent on the accuracy and real-time nature of the underlying market data feed.
♦ Latencies: Trade alerts and signals may be subject to minor delays due to server processing, internet connectivity, or charting platform performance. Do not rely solely on alerts for execution.
♦ Backtesting and Performance: Any depiction of past performance, including data visible on the chart, is not indicative of future results. Trading results will vary based on market conditions, liquidity, and execution speed.
4. Software and Platform Disclaimer
"As Is" Basis: The indicator is provided on an "as is" basis without warranties of any kind, whether express or implied. The author does not guarantee the script will be error-free or operate without interruption.
Third-Party Integration: This indicator is not affiliated with, endorsed by, or connected to TradingView, 3Commas, or any other broker or execution platform. All third-party names are trademarks of their respective owners. The formatting of the Trade Summary Table for 3Commas is for user convenience only.
5. Required Competency (User Responsibility)
This indicator is built on the assumption that the user is an experienced trader with a working understanding of the complex concepts being visualized (ICT/SMC, FVG, Order Blocks, Liquidity, etc.). The indicator does not teach these concepts.
You Must Always Do Your Own Research (DYOR) before making any trading decision based on signals or visualization provided by this tool.
By installing and using this indicator, you explicitly agree to these terms and assume full responsibility for all trading activity.

ATR Trailing Stop (Long or Short Selectable)The ATR Trailing Stop (Long or Short Selectable) will start calculating on a set date that you specify. This is great because you want to trail the price from the breakout day or even after exceeding specific price level (can be your breakeven level or even to capture more of the upside after the price target is met).
Entry price: If you act at the close of the day, you can leave this value as 0 and it will take the close of the day for the initial protective stop-loss calculation. You can choose to add a value such as the pattern boundary and in that case it will subtract the initial protective stop-loss from the pattern boundary and not the close of the day. If you use a scaling in tactic during the day (buying in tranches intraday as the breakout takes place) and your average purchase price is different than the close of the day, you can also plug that number in to calculate the initial protective stop-loss.
This is a modified version as many followers asked for ATR trailing for short setups. Now you can select the Long/Short trade setup from the drop down menu.
ATR period: You can select the ATR period. It can be 10 day, 14 day or 30 day or any ATR period of your choice.
ATR Multiplier for Stop-loss: This is the multiplier that you want to trail the price with. From the highest level price reached it will trail the price with a 3 x ATR () distance. The higher the number, the wider the trailing stop-loss. A multiplier of 1 will trail the price so close that and adverse movement can result in triggering the stop-loss.
Custom Value for First day Trailing Stop: This is my favorite part. For aggressive risk management, your initial protective stop can be smaller than what the ATR Trailing Stop will use in its calculation after entry day. In this case you can take 1xATR () or even with FX and Futures you can apply 0.5xATR() as the first day to calculate initial protective stop. The protective stop turns into a trailing stop after the first day.
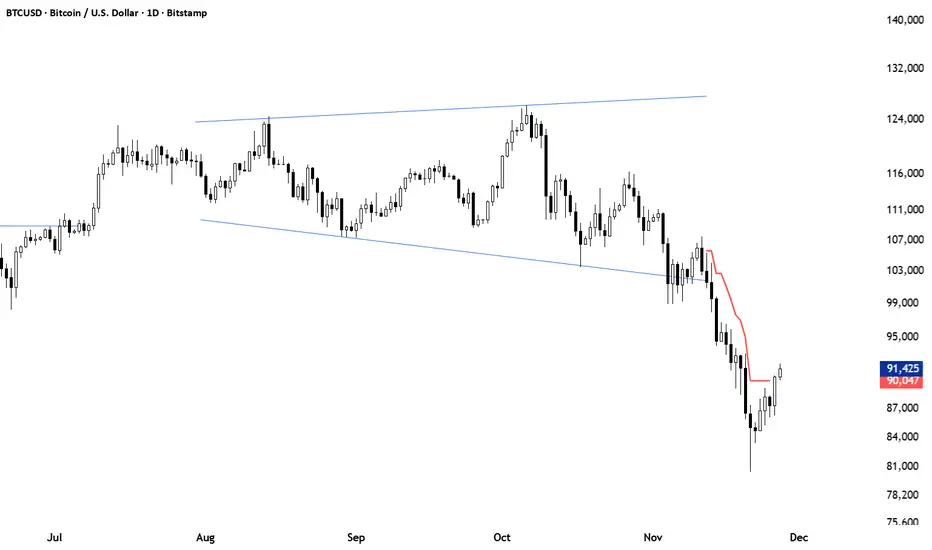
MACD Trading System - Professional V2# MACD Trading System - Professional V2
## Executive Summary
**MACD Pro V2** is an institutional-grade trading indicator combining classical MACD analysis with advanced risk management, multi-timeframe confirmation, and comprehensive performance metrics. Designed for both manual traders and algorithmic systems, this indicator provides actionable signals with built-in stop loss calculation, take profit targets, position sizing, and trailing stop logic.
This indicator is NOT just a signal generator—it's a complete trading system with risk/reward management, performance tracking, and market regime detection.
---
## Core Features
### 1. Advanced MACD Calculation
- **Customizable EMAs**: Fast (default 8), Slow (default 21), Signal (default 5)
- **Confirmed Signals**: Uses barstate.isconfirmed to prevent repainting
- **Zero-Line Position**: Shows MACD above/below zero for momentum context
### 2. Multi-Timeframe Analysis
- **4 Simultaneous Timeframes**: 4H, 1H, 15M, 5M analyzed in parallel
- **MTF Alignment Score**: 0-100% showing consensus across timeframes
- **Smart Requests**: Uses lookahead=barmerge.lookahead_off for accuracy
### 3. Market Regime Detection
Automatically identifies current market conditions:
- **TRENDING** - ADX > 25, strong directional movement
- **RANGING** - ADX < 20, choppy sideways movement
- **VOLATILE** - ATR > 1.5x average, high uncertainty
- **NORMAL** - Default market state
### 4. Integrated Risk Management
Complete position management system:
- **Stop Loss Calculation**: Automatic SL placement based on ATR × multiplier
- **Take Profit Targets**: Calculated using Risk:Reward ratio (default 2:1)
- **Position Sizing**: Scales position size based on account risk percentage
- **Trailing Stop**: Dynamically adjusts SL as price moves in your favor
- **Drawdown Monitoring**: Tracks maximum drawdown vs account
### 5. Advanced Signal Scoring
0-100 point system weighing:
- **MTF Alignment (35%)**: Multi-timeframe confirmation strength
- **Momentum (25%)**: RSI conditions + Divergence detection
- **Volume (20%)**: Volume profile and confirmation
- **Volatility (20%)**: Market regime adjustment
**Signal Classifications:**
- **STRONG (70+)**: High confidence, tight stops, optimal entry
- **MEDIUM (50-69)**: Valid signals, confirm with price action
- **WEAK (<50)**: Low conviction, skip or use tight risk management
### 6. Professional Performance Metrics
Real-time trading statistics:
- **Win Rate**: Percentage of winning trades
- **Max Drawdown**: Largest peak-to-trough decline
- **Sharpe Ratio**: Risk-adjusted returns (anualized)
- **Profit Factor**: Gross profit / Gross loss ratio
- **Consecutive Losses**: Psychological stress indicator
### 7. Advanced Filtering System
- **Divergence Detection**: Automatic bullish/bearish divergence identification
- **Support/Resistance**: Pivot-based dynamic S/R levels
- **Volume Confirmation**: Only takes signals with volume > 1.0x average
- **Session Filter**: Optional trading hours restriction
- **Volatility Adjustment**: Reduces entries in extremely high volatility
---
## How It Works
### Signal Generation Process
**Step 1: MACD Crossover**
- Crossover of MACD above/below signal line triggers base signal
- Uses confirmed values to prevent false signals
**Step 2: Multi-Timeframe Confirmation**
- Checks trend alignment on 4H, 1H, 15M, 5M
- Calculates MTF alignment percentage
- Higher alignment = higher confidence
**Step 3: Advanced Scoring**
Signal is scored on 100-point scale:
- MTF alignment contribution (35 pts max)
- RSI + Divergence (25 pts max)
- Volume profile (20 pts max)
- Volatility regime adjustment (20 pts max)
**Step 4: Filter Application**
- Session filter (if enabled)
- Support/Resistance proximity bonus
- Volume confirmation requirement
- Drawdown check (if risk mgmt enabled)
**Step 5: Risk Calculation**
- Stop Loss placed 2 ATR below entry (customizable)
- Take Profit calculated using 2:1 risk/reward ratio
- Position size scaled to risk 1% per trade
- Trailing stop activated after 1R profit
**Step 6: Signal Output**
- Buy Signal: Green triangle (Strong) or circle (Medium)
- Sell Signal: Red triangle (Strong) or circle (Medium)
- Dashboard shows complete trade details
---
## Trading Scenarios
### Scenario 1: Strong Buy Setup
```
Requirements met:
✓ MACD crosses above signal line
✓ 3/4 timeframes bullish (4H, 1H, 15M)
✓ RSI oversold (< 30)
✓ Volume spike confirmed
✓ Score: 78/100 → STRONG BUY
System provides:
- Entry: Current price
- Stop Loss: 2 ATR below entry
- Take Profit: 2× risk distance above
- Position Size: Adjusted to 1% account risk
- Trailing Stop: Activates at 1R profit
```
### Scenario 2: Medium Buy with Divergence
```
Requirements met:
✓ MACD crosses above signal line
✓ 2/4 timeframes bullish (4H, 1H)
✓ Bullish divergence detected
✓ Price near support level
✓ Score: 62/100 → MEDIUM BUY
Considerations:
- Lower confidence → tighter risk management
- Use smaller position size
- Require additional confirmation
- Better as counter-trend entry
```
### Scenario 3: Ranging Market Filter
```
Market condition detected: RANGING
ADX < 20, sideways movement
System response:
- Reduces signal score by volatility adjustment
- May skip signals entirely
- Prioritizes higher confluence
- Warns of low trend probability
Best action: Wait for trending market
```
---
## Risk Management Deep Dive
### Stop Loss Calculation
```
Stop Loss Distance = ATR × ATR Multiplier (default 2.0)
Example:
- Current price: 1.0850
- ATR(14): 0.0045
- SL Distance: 0.0045 × 2.0 = 0.009
- BUY SL: 1.0850 - 0.009 = 1.0760
```
### Position Sizing
```
Position Size = (Account Risk % / Price Risk %)
Example:
- Risk per trade: 1% of account
- Stop distance: 0.009 on price of 1.0850
- Price risk: 0.009 / 1.0850 = 0.83%
- Position size: 1.0% / 0.83% = 1.2x (capped at 1.0x max)
```
### Trailing Stop Logic
```
Normal SL: 2 ATR below entry
Trigger Level: Entry + (Entry - SL) × Trail Activation (1.0R)
Trailing Mechanism:
- If price hits trigger, trailing SL activates
- SL moves up to: Close - 2 ATR
- SL never moves down, only up (for longs)
- Protects profits while allowing upside
```
### Drawdown Protection
```
Tracks:
- Peak equity reached
- Current drawdown from peak
- Maximum drawdown recorded
- Stops trading if max DD exceeded
Example:
- Peak: $10,000
- Current: $9,200
- Drawdown: 8%
- Max allowed: 10%
- Status: CONTINUE TRADING
```
---
## Dashboard Metrics Explained
### Market Section
- **Market Regime**: Current state (Trending/Ranging/Volatile/Normal)
- **ADX Value**: Trend strength indicator (0-100)
### Position Section
- **Current Position**: LONG, SHORT, or NONE
- **P&L**: Unrealized profit/loss percentage if in position
### Timeframe Section
- Individual 4H/1H/15M trend status
- **Alignment**: Percentage of bullish timeframes
### Risk Management Section
- **Stop Loss %**: Distance from current price
- **Take Profit %**: Target profit distance
- **Position Size**: Capital allocation multiplier
- **Risk %**: Per-trade risk percentage
### Performance Section
- **Win Rate**: % of winning trades (>60% is excellent)
- **Max DD**: Maximum drawdown experienced
- **Sharpe Ratio**: Risk-adjusted return metric
- **Profit Factor**: Ratio of profits to losses
### Indicators Section
- **RSI**: Momentum and overbought/oversold levels
- **Volume**: Current vs. average volume ratio
- **Divergence**: Active divergence detection
---
## Advanced Features
### Divergence Detection
```
Bullish Divergence:
- Price makes lower low
- MACD makes higher high
- Signals potential reversal UP
Bearish Divergence:
- Price makes higher high
- MACD makes lower low
- Signals potential reversal DOWN
Lookback: 20 bars (customizable)
```
### Support & Resistance
```
Method: Pivot High/Low detection
- Pivot Left/Right: 10 bars
- Dynamic S/R levels update as new pivots form
- Bonus score if entry near identified levels
```
### Performance Tracking
Real-time statistics calculated from:
- Win/loss signals
- Profit/loss per trade
- Consecutive losing trades
- Cumulative returns
- Standard deviation (Sharpe calculation)
Stores last 100 trades in memory for statistics.
---
## Input Parameters Explained
### MACD Settings
- **Fast EMA** (5-13): Lower = more responsive, more false signals
- **Slow EMA** (20-26): Higher = smoother, misses faster moves
- **Signal EMA** (5-9): Crossover sensitivity
### Risk Management
- **ATR Period** (default 14): Volatility measurement period
- **SL ATR Multiplier** (1.5-3.0): Stop loss tightness
- **Risk:Reward Ratio** (1-5): Profit target calculation
- **Trail Activation** (0.5-2.0): When to start trailing stop
- **Risk Per Trade** (0.1-5.0): Account risk percentage
- **Max Drawdown** (5-30%): Trading pause threshold
### Scoring Weights
Customize signal emphasis:
- **MTF Alignment** (35%): How important is multi-timeframe
- **Momentum** (25%): RSI and divergence weight
- **Volume** (20%): Volume confirmation priority
- **Volatility** (20%): Regime adjustment strength
### Advanced Filters
- **Check Divergence**: Enable/disable divergence scoring
- **Session Filter**: Restrict to specific hours
- **Min Volume Ratio**: Minimum volume for signal
### Display
- **Show Dashboard**: Main metrics table
- **Show Performance**: Trading statistics
- **Show S/R Levels**: Support/resistance visualization
---
## Best Practices
1. **Backtest Before Trading**: Test parameters on your preferred pairs
2. **Start with Strong Signals**: Use only 70+ scored signals initially
3. **Position Size**: Never risk more than 1-2% per trade
4. **Market Regime Awareness**: Skip ranging market entries
5. **Volume Confirmation**: Always check volume spikes
6. **Profit Taking**: Lock in profits at TP, don't let winners die
7. **Loss Management**: Honor stop losses, don't move them
8. **Performance Review**: Check metrics weekly, adjust if needed
---
## Trading Strategy Examples
### Conservative Strategy (Win-Rate Focus)
```
Settings:
- Signal Score Minimum: 70+ (Strong only)
- Risk Per Trade: 0.5%
- Risk:Reward: 3:1
- Position Size: 0.5x (smaller)
Targets:
- Win Rate > 65%
- Max DD < 5%
- Profit Factor > 2.0
```
### Aggressive Strategy (Profit Focus)
```
Settings:
- Signal Score Minimum: 50+ (Medium+)
- Risk Per Trade: 2%
- Risk:Reward: 1.5:1
- Position Size: 1.0x (maximum)
Targets:
- Win Rate > 55%
- Max DD < 10%
- Profit Factor > 1.5
```
### Trend Trading Strategy
```
Settings:
- Only trade when ADX > 25 (Trending)
- MTF Alignment: 3+ timeframes
- Use Trailing Stop: Yes
- Risk:Reward: 2.5:1
Focus on: Riding large moves
Best on: 4H timeframe
Pairs: Trending majors (EURUSD, GBPUSD)
```
### Divergence Trading Strategy
```
Settings:
- Signal Score Minimum: 60+
- Enable Divergence: Yes
- Volume Confirmation: Required
- Position Size: 0.75x
Focus on: Reversal entries
Best setup: Divergence at resistance/support
Risk management: Tight stops (1.5 ATR)
```
---
## Advantages
✓ Complete trading system, not just signals
✓ Built-in risk management and position sizing
✓ Real-time performance tracking
✓ Multi-timeframe confirmation reduces false signals
✓ Advanced filtering and divergence detection
✓ Market regime awareness
✓ Customizable scoring weights
✓ Professional dashboard display
✓ Support/resistance integration
✓ Trailing stop logic for profit protection
---
## Limitations
- Lagging indicator (uses confirmed bars)
- Works best on trending markets
- Not optimized for news/event trading
- Requires parameter optimization per pair
- Performance varies by timeframe
- Past performance doesn't guarantee future results
- Can produce whipsaw signals in ranging markets
---
## System Requirements
- TradingView Premium or higher (for advanced charting)
- Recommended: 4H or 1H timeframe
- Historical data: Minimum 100 bars
- Currency pairs: Works on all FX pairs, stocks, commodities
---
## Disclaimer
This indicator is provided for educational and informational purposes only. It is not financial advice and does not guarantee profits. Past performance does not predict future results.
**Important Notices:**
- Always use proper risk management
- Trade only with capital you can afford to lose
- Backtest thoroughly before live trading
- Combine with your own analysis
- Consider external market factors and news
- Monitor positions actively
- Keep emotional discipline
---
## Support & Optimization
For best results:
1. Test on your preferred instrument (6-12 months history)
2. Adjust MACD parameters to your timeframe
3. Optimize scoring weights to your style
4. Set risk management per your account size
5. Document your trade results and review weekly
6. Adapt parameters if performance degrades
This is a powerful system when used correctly. Respect the rules and let statistics work in your favor.

MNQ TopStep 50K | Ultra Quality v3.0MNQ TopStep 50K | Ultra Quality v3.0 - Publish Summary
📊 Overview
A professional-grade trading indicator designed specifically for MNQ futures traders using TopStep funded accounts. Combines 7 technical confirmations with 5 advanced safety filters to deliver high-quality trade signals while managing drawdown risk.
🎯 Key Features
Core Signal System
7-Point Confirmation: VWAP, EMA crossovers, 15-min HTF trend, MACD, RSI, ADX, and Volume
Signal Grading: Each signal is rated A+ through D based on 7 quality factors
Quality Threshold: Adjustable minimum grade requirement (A+, A, B, C, D)
Advanced Safety Filters (Customizable)
Mean Reversion Filter - Prevents chasing extended moves beyond VWAP bands
ATR Spike Filter - Avoids trading during extreme volatility events
EMA Spacing Filter - Ensures proper trend separation (optional)
Momentum Filter - Requires consecutive directional bars (optional)
Multi-Timeframe Confirmation - Aligns with 15-min trend (optional)
TopStep Risk Management
Real-time drawdown tracking
Position sizing calculator based on remaining cushion
Daily loss limit monitoring
Consecutive loss protection
Max trades per day limiter
Visual Components
VWAP with 1σ, 2σ, 3σ bands
EMA 9/21 with cloud fill
15-min EMA 50 for HTF trend
Comprehensive metrics dashboard
Risk management panel
Filter status panel
Detailed trade labels with entry, stops, and targets
⚙️ Default Settings (Balanced for Regular Signals)
Technical Indicators
Fast EMA: 9 | Slow EMA: 21 | HTF EMA: 50 (15-min)
MACD: 10/22/9
RSI: 14 period | Thresholds: 52 (buy) / 48 (sell)
ADX: 14 period | Minimum: 20
ATR: 14 period | Stop: 2x | TP1: 2x | TP2: 3x
Volume: 1.2x average required
Session Settings
Default: 9:30 AM - 11:30 AM ET (adjustable)
Avoids first 15 minutes after market open
Customizable trading hours
Safety Filters (Default Configuration)
✅ Mean Reversion: Enabled (2.5σ max from VWAP)
✅ ATR Spike: Enabled (2.0x threshold)
❌ EMA Spacing: Disabled (can enable for quality)
❌ Momentum: Disabled (can enable for quality)
❌ MTF Confirmation: Disabled (can enable for quality)
Risk Controls
Minimum Signal Quality: C (adjustable to A+ for fewer/better signals)
Min Bars Between Signals: 10
Max Trades Per Day: 5
Stop After Consecutive Losses: 2
📈 Expected Performance
With Default Settings:
Signals per week: 10-15 trades
Estimated win rate: 55-60%
Risk-Reward: 1:2 (TP1) and 1:3 (TP2)
With Aggressive Settings (Min Quality = D, All Filters Off):
Signals per week: 20-25 trades
Estimated win rate: 50-55%
With Conservative Settings (Min Quality = A, All Filters On):
Signals per week: 3-5 trades
Estimated win rate: 65-70%
🚀 How to Use
Basic Setup:
Add indicator to MNQ 5-minute chart
Adjust TopStep account settings in inputs
Set your risk per trade percentage (default: 0.5%)
Configure trading session hours
Set minimum signal quality (Start with C for balanced results)
Signal Interpretation:
Green Triangle (BUY): Long signal - all confirmations aligned
Red Triangle (SELL): Short signal - all confirmations aligned
Label Details: Shows entry, stop loss, take profit levels, position size, and signal grade
Signal Grade: A+ = Elite (6-7 points) | A = Strong (5) | B = Good (4) | C = Fair (3)
Dashboard Monitoring:
Top Right: Technical metrics and market conditions
Top Left: Filter status (which filters are passing/blocking)
Bottom Right: TopStep risk metrics and position sizing
⚡ Customization Tips
For More Signals:
Lower "Minimum Signal Quality" to D
Decrease ADX threshold to 18-20
Lower RSI thresholds to 50/50
Reduce Volume multiplier to 1.1x
Disable additional filters
For Higher Quality (Fewer Signals):
Raise "Minimum Signal Quality" to A or A+
Increase ADX threshold to 25-30
Enable all 5 advanced filters
Tighten VWAP distance to 2.0σ
Increase momentum requirement to 3-4 bars
For TopStep Compliance:
Adjust "Max Total Drawdown" and "Daily Loss Limit" to match your account
Update "Already Used Drawdown" daily
Monitor the Risk Panel for cushion remaining
Use recommended contract sizing
🛡️ Risk Disclaimer
IMPORTANT: This indicator is for educational and informational purposes only.
Past performance does not guarantee future results
All trading involves substantial risk of loss
Use proper risk management and position sizing
Test thoroughly in paper trading before live use
The indicator does not guarantee profitable trades
Adjust settings based on your risk tolerance and trading style
Always comply with your broker's and TopStep's rules

MNQ TopStep 50K | Ultra Quality v3.0MNQ TopStep 50K | Ultra Quality v3.0 - Publish Summary📊 OverviewA professional-grade trading indicator designed specifically for MNQ futures traders using TopStep funded accounts. Combines 7 technical confirmations with 5 advanced safety filters to deliver high-quality trade signals while managing drawdown risk.🎯 Key FeaturesCore Signal System
7-Point Confirmation: VWAP, EMA crossovers, 15-min HTF trend, MACD, RSI, ADX, and Volume
Signal Grading: Each signal is rated A+ through D based on 7 quality factors
Quality Threshold: Adjustable minimum grade requirement (A+, A, B, C, D)
Advanced Safety Filters (Customizable)
Mean Reversion Filter - Prevents chasing extended moves beyond VWAP bands
ATR Spike Filter - Avoids trading during extreme volatility events
EMA Spacing Filter - Ensures proper trend separation (optional)
Momentum Filter - Requires consecutive directional bars (optional)
Multi-Timeframe Confirmation - Aligns with 15-min trend (optional)
TopStep Risk Management
Real-time drawdown tracking
Position sizing calculator based on remaining cushion
Daily loss limit monitoring
Consecutive loss protection
Max trades per day limiter
Visual Components
VWAP with 1σ, 2σ, 3σ bands
EMA 9/21 with cloud fill
15-min EMA 50 for HTF trend
Comprehensive metrics dashboard
Risk management panel
Filter status panel
Detailed trade labels with entry, stops, and targets
⚙️ Default Settings (Balanced for Regular Signals)Technical Indicators
Fast EMA: 9 | Slow EMA: 21 | HTF EMA: 50 (15-min)
MACD: 10/22/9
RSI: 14 period | Thresholds: 52 (buy) / 48 (sell)
ADX: 14 period | Minimum: 20
ATR: 14 period | Stop: 2x | TP1: 2x | TP2: 3x
Volume: 1.2x average required
Session Settings
Default: 9:30 AM - 11:30 AM ET (adjustable)
Avoids first 15 minutes after market open
Customizable trading hours
Safety Filters (Default Configuration)
✅ Mean Reversion: Enabled (2.5σ max from VWAP)
✅ ATR Spike: Enabled (2.0x threshold)
❌ EMA Spacing: Disabled (can enable for quality)
❌ Momentum: Disabled (can enable for quality)
❌ MTF Confirmation: Disabled (can enable for quality)
Risk Controls
Minimum Signal Quality: C (adjustable to A+ for fewer/better signals)
Min Bars Between Signals: 10
Max Trades Per Day: 5
Stop After Consecutive Losses: 2
📈 Expected PerformanceWith Default Settings:
Signals per week: 10-15 trades
Estimated win rate: 55-60%
Risk-Reward: 1:2 (TP1) and 1:3 (TP2)
With Aggressive Settings (Min Quality = D, All Filters Off):
Signals per week: 20-25 trades
Estimated win rate: 50-55%
With Conservative Settings (Min Quality = A, All Filters On):
Signals per week: 3-5 trades
Estimated win rate: 65-70%
🚀 How to UseBasic Setup:
Add indicator to MNQ 5-minute chart
Adjust TopStep account settings in inputs
Set your risk per trade percentage (default: 0.5%)
Configure trading session hours
Set minimum signal quality (Start with C for balanced results)
Signal Interpretation:
Green Triangle (BUY): Long signal - all confirmations aligned
Red Triangle (SELL): Short signal - all confirmations aligned
Label Details: Shows entry, stop loss, take profit levels, position size, and signal grade
Signal Grade: A+ = Elite (6-7 points) | A = Strong (5) | B = Good (4) | C = Fair (3)
Dashboard Monitoring:
Top Right: Technical metrics and market conditions
Top Left: Filter status (which filters are passing/blocking)
Bottom Right: TopStep risk metrics and position sizing
⚡ Customization TipsFor More Signals:
Lower "Minimum Signal Quality" to D
Decrease ADX threshold to 18-20
Lower RSI thresholds to 50/50
Reduce Volume multiplier to 1.1x
Disable additional filters
For Higher Quality (Fewer Signals):
Raise "Minimum Signal Quality" to A or A+
Increase ADX threshold to 25-30
Enable all 5 advanced filters
Tighten VWAP distance to 2.0σ
Increase momentum requirement to 3-4 bars
For TopStep Compliance:
Adjust "Max Total Drawdown" and "Daily Loss Limit" to match your account
Update "Already Used Drawdown" daily
Monitor the Risk Panel for cushion remaining
Use recommended contract sizing
🛡️ Risk DisclaimerIMPORTANT: This indicator is for educational and informational purposes only.
Past performance does not guarantee future results
All trading involves substantial risk of loss
Use proper risk management and position sizing
Test thoroughly in paper trading before live use
The indicator does not guarantee profitable trades
Adjust settings based on your risk tolerance and trading style
Always comply with your broker's and TopStep's rules

SL Hunting Detector📌 Step 1: Identify Liquidity Zones
The script plots high-liquidity zones (red) and low-liquidity zones (green).
These are areas where big players target stop-losses before reversing the price.
Example:
If price is near a red liquidity zone, expect a potential stop-loss hunt & reversal downward.
If price is near a green liquidity zone, expect a potential stop-loss hunt & reversal upward.
📌 Step 2: Watch for Stop-Loss Hunts (Fakeouts)
The indicator marks stop-loss hunts with red (bearish) or green (bullish) arrows.
When do stop-loss hunts occur?
✅ A long wick below support (with high volume) = Stop hunt before reversal upward.
✅ A long wick above resistance (with high volume) = Stop hunt before reversal downward.
Confirmation:
Volume must spike (volume > 1.5x the average volume).
ATR-based wicks must be longer than usual (showing a stop-hunt trap).
📌 Step 3: Enter a Trade After a Stop-Hunt
🔹 Bullish Trade (Buying a Dip)
If a green arrow appears (stop-hunt below support):
✅ Enter a long (buy) trade at or just above the wick’s recovery level.
✅ Stop-loss: Below the wick’s low (avoid getting hunted again).
✅ Take-profit: Next resistance level or mid-range of the liquidity zone.
🔹 Bearish Trade (Shorting a Fakeout)
If a red arrow appears (stop-hunt above resistance):
✅ Enter a short (sell) trade at or just below the wick’s rejection level.
✅ Stop-loss: Above the wick’s high (avoid getting stopped out).
✅ Take-profit: Next support level or mid-range of the liquidity zone.
📌 Step 4: Set Alerts & Automate
✅ The indicator triggers alerts when a stop-hunt is detected.
✅ You can set TradingView to notify you instantly when:
A bullish stop-hunt occurs → Look for long entry.
A bearish stop-hunt occurs → Look for short entry.
📌 Example Trade Setup
Example (BTC Long Trade on Stop-Hunt)
BTC is near $40,000 support (green liquidity zone).
A long wick drops to $39,800 with a green arrow (bullish stop-hunt signal).
Volume spikes, and price recovers quickly back above $40,000.
Trade entry: Buy at $40,050.
Stop-loss: Below wick ($39,700).
Take-profit: $41,500 (next resistance).
Result: BTC pumps, stop-loss remains safe, and trade profits.
🔥 Final Tips
Always wait for confirmation (don’t enter blindly on signals).
Use higher timeframes (15m, 1H, 4H) for better accuracy.
Combine with Order Flow tools (like Bookmap) to see real liquidity zones.
🚀 Now try it on TradingView! Let me know if you need adjustments. 📈🔥

Risk Management Calculator with Fees and Take Profit [CHE]Risk Management Calculator with Fees and Take Profit
Welcome to the Risk Management Calculator with Fees and Take Profit script! This powerful tool is designed to help traders manage their risk effectively, calculate leverage, and set take profit targets. The script is inspired by and builds upon the ideas from the following TradingView script: ().
This script is inspired by and builds upon the ideas from the following TradingView script:
Features
1. Portfolio Size Input: Enter the size of your portfolio to accurately calculate your risk and leverage.
2. Max Loss Percent Input: Specify the maximum percentage of your portfolio that you are willing to risk on a single trade.
3. Max Leverage Input: Set the maximum leverage you are comfortable using.
4. Trading Fee Input: Include trading fees in your calculations to get a more realistic view of your potential losses and gains.
5. ATR Settings: Configure the ATR period and multiplier to calculate your stop loss and take profit levels.
6. RSI Settings: Adjust the RSI period for trend analysis.
How to Use
Portfolio Size
- Description: This is the total value of your trading account.
- Input: `portfolioSize`
- Default Value: 100
- Minimum Value: 0.001
Max Loss Percent
- Description: The maximum percentage of your portfolio you are willing to lose on a single trade.
- Input: `maxLossPercent`
- Default Value: 3%
- Range: 0.1% to 100%
Max Leverage
- Description: The maximum leverage you wish to use.
- Input: `maxLeverage`
- Default Value: 125
- Range: 1 to 125
Trading Fee
- Description: The fee percentage you pay per trade.
- Input: `feeRate`
- Default Value: 1%
- Range: 0% to 10%
ATR Settings
- ATR Period: Number of bars used to calculate the Average True Range.
- Input: `atrPeriod`
- Default Value: 5
- ATR Multiplier: Multiplier for ATR to set stop loss levels.
- Input: `atrMultiplier`
- Default Value: 2.0
Take Profit Multiplier
- Description: Multiplier for ATR to set take profit levels.
- Input: `takeProfitMultiplier`
- Default Value: 2.0
RSI Settings
- RSI Period: Period for the RSI calculation.
- Input: `rsiPeriod`
- Default Value: 14
Dashboard
The script includes a customizable dashboard that displays the following information:
- Portfolio Size
- Maximum Loss Amount
- Entry Price
- Stop Loss Price
- Stop Loss Percentage
- Calculated Leverage
- Order Value
- Order Quantity
- Trend Direction
- Adjusted Maximum Loss Percentage
- Take Profit Price
Dashboard Settings
- Location: Choose the position of the dashboard on the chart.
- Options: 'Top Right', 'Bottom Right', 'Top Left', 'Bottom Left'
- Size: Adjust the size of the dashboard text.
- Options: 'Tiny', 'Small', 'Normal', 'Large'
- Text/Frame Color: Set the color for the text and frame of the dashboard.
Underlying Principles and Assumptions
Leverage Calculation
The leverage calculation is fundamental to risk management in trading. It ensures that the risk per trade does not exceed a specified percentage of the portfolio. This calculation takes into account the potential loss from the entry price to the stop loss level, adjusted for trading fees. By dividing the maximum acceptable loss by the total potential loss (including fees), we derive a leverage that limits the exposure per trade. This approach helps traders avoid over-leveraging, which can lead to significant losses.
ATR and Stop Loss
The Average True Range (ATR) is used to set stop loss levels because it measures market volatility. A higher ATR indicates more volatility, which means wider stop losses are needed to avoid being prematurely stopped out by normal market fluctuations. By using an ATR multiplier, the stop loss is dynamically adjusted based on current market conditions, providing a more robust risk management strategy.
Take Profit Calculation
The take profit level is calculated as a multiple of the ATR, ensuring that it is set at a realistic level relative to market volatility. This method aims to capture significant price movements while avoiding the noise of smaller fluctuations. Setting take profit targets this way helps in locking in profits when the market moves favorably.
RSI for Trend Confirmation
The Relative Strength Index (RSI) is used to confirm the trend direction. An RSI above 50 typically indicates a bullish trend, while an RSI below 50 indicates a bearish trend. By aligning trades with the prevailing trend, the script increases the probability of successful trades. This trend confirmation helps in making informed decisions about leverage and position sizing.
Risk Color Coding
The script uses color coding to visually indicate the risk level and trend direction. Green indicates a favorable condition for long trades, red for short trades, and gray for neutral conditions. This intuitive color coding aids in quickly assessing the market conditions and making timely trading decisions.
Conclusion
This script aims to provide a comprehensive risk management tool for traders. By integrating portfolio size, leverage, fees, ATR, and RSI, it helps in making informed trading decisions. We hope you find this tool useful in your trading journey.
Happy Trading!

Position Size Calculator for ContractDescription:
Position Size Calculator is a versatile Pine Script tool designed to help traders manage their risk and position sizing effectively. This script calculates essential trading metrics and visualizes them directly on your chart, helping you make informed trading decisions.
Features:
- Account Size & Risk Management:
- Account Size: Input your total account balance to calculate position sizes.
- Maximum Risk: Define how much of your account you are willing to risk per trade in dollars.
- Pip Value: Set the value of a single pip for one contract, which is crucial for calculating risk
and position size.
Trade Setup Visualization:
- Entry Price: Specify the price at which you plan to enter the trade.
- Stop Loss: Define your stop loss level to manage your risk.
- Take Profit: Set your target profit level for the trade.
- Visualize the Entry, Stop Loss, and Take Profit levels on your chart with customizable line
colors and text sizes.
- View the distance in pips between the Entry, Stop Loss, and Take Profit levels.
Position Size Calculation:
- Calculates the number of contracts to open based on your risk tolerance and the pip value.
- Displays the maximum number of contracts you can open given your risk parameters.
Customizable Table Display:
- Table Position: Choose the position of the summary table on the chart (Top-Left, Top-Right,
Bottom-Left, Bottom-Right, etc.).
- Table Text Size: Adjust the text size for the summary table.
- Table Background Color: Set the background color for the summary table.
- Table Border Color: Customize the border color of the summary table.
How to Use:
1- Input your Account Size: Enter your current account balance.
2- Set Maximum Risk and Pip Value: Define how much you're willing to risk per trade and the
pip value for your contract.
3- Define Trade Levels: Input your desired Entry Price, Stop Loss, and Take Profit levels.
4- Customize Visuals: Adjust the line styles and table settings to fit your preferences.
5- View Calculations: The script will display the distance in pips and the calculated position
size directly on your chart.
Example Usage:
Example to calculate the value of 1 pips with 1 contract:
Inputs:
Account Size: Your total trading account balance.
Maximum Risk: Risk amount per trade in dollars.
Pip Value: Value of one pip for a single contract.
Entry Price: The price at which you plan to enter the trade.
Stop Loss: The level at which you will exit the trade to cut losses.
Take Profit: The target price to lock in profits.
Line Text Size: Size of the text for the Entry, Stop Loss, and Take Profit lines.
Line Extend: Option to extend the lines for visual clarity.
Table Position: Position of the summary table on the chart.
Table Text Size: Size of the text in the summary table.
Table Background Color: Background color of the summary table.
Table Border Color: Border color of the summary table.
Visuals:
Entry Price, Stop Loss, and Take Profit levels are clearly marked on the chart.
Summary Table with important trade metrics displayed.

Notional Trade Table
Notional Trade Table indicator displays notional trade values for given Buy and Sell of given input of Symbol, Quantity, Entry Price and Stop Loss .
Sections of Input Menu Table are supported with Tool Tip icons.
Input Symbols:
(Refer Input Menu)
User can choose maximum 20 Symbols.
Input Side Choice (BUY/SELL):
(Refer Input Menu)
After choosing Symbol, User has to choose the BUY or SELL option for each Symbol against the corresponding Sybol number. If NIL is selected “Nil is selected ” message is displayed prompting the user to select BUY or SELL sides.
For example in the above Input Menu:
Sym1 is BATS:AAPL. Corresponding Side 1 is Sell1.
Sym2 is BATS:NVDA Corresponding Side 2 Sell 2.
Sym12 is BATS:NFLX. Corresponding Side 12 is Buy12 and so on.
Input Quantity:
(Refer Input Menu)
Next enter Corresponding Quantity of BUY or SELL in relevant Quantity Input Box. Quantity cannot be Zero. Defval is 1.
For Sym1 input in Qty 1 box,for Sym2 input in Qty 2 box and so on.
Input Entry Price:
(Refer Input Menu)
After entering Quantity Input Entry Price for Corresponding Symbol.
Input for Sym1 Entry Price in EP1 box
Input for Sym2 Entry Price in EP2 box
and so on.
Input Stop Loss:
(Refer Input Menu)
Next Enter corresponding Stop Loss for each Symbol.
SL1 input box denotes Sym1 Stop Loss.
SL2 input box denotes Sym2 Stop Loss.
SL3 input box denotes Sym3 Stop Loss and so on.
Stop Loss for Chosen BUY side should be below corresponding Entry Price/Last Price. Otherwise a message is displayed “SL Hit”. User has to enter valid data.
Stop Loss for Chosen SELL side should be above corresponding Entry Price/Last Price. Otherwise a message is displayed “SL Hit”. User has to enter valid data.
Notional Trade Table:
(Refer the Table on Chart)
From the input menu filled by User script captures the Symbol, BUY/SELL options, Quantity,
Entry Price and Stop Loss details under the corresponding heads in the Notional Trade Table.
The script captures the live Last traded Price under the head LP and calculates and displays corresponding Profit or Loss under PR/LO column in the table.
SL+- LP is the difference between Last traded Price (LP) and Stop Loss Price. Positive figure under this head reflects Stop Loss cushion available .
Nil header column reflects message “NIL selected” prompting the User to select BUY or SELL sides.
SLH header displays “SL Hit” on Stop Loss Hit or wrong input of Stop Loss inconsistent with BUY or SELL sides of Trade. On “SL Hit” message all values in corresponding Symbol becomes Zero. User has to re-enter the details fresh .
On the top left side corner of the table there are 2 cells with Prono and Lono.They denote the number of trades which are in Profit (Prono) and which are in Loss(Lono).
It is preferable to choose Symbols from a single country exchange commensurate with the Time zone. Otherwise if Exchange and Chart time Zone differs there is risk of data loss in the table.
DISCLAIMER: For educational and entertainment purpose only .Nothing in this content should be interpreted as financial advice or a recommendation to buy or sell any sort of security/ies or investment/s.
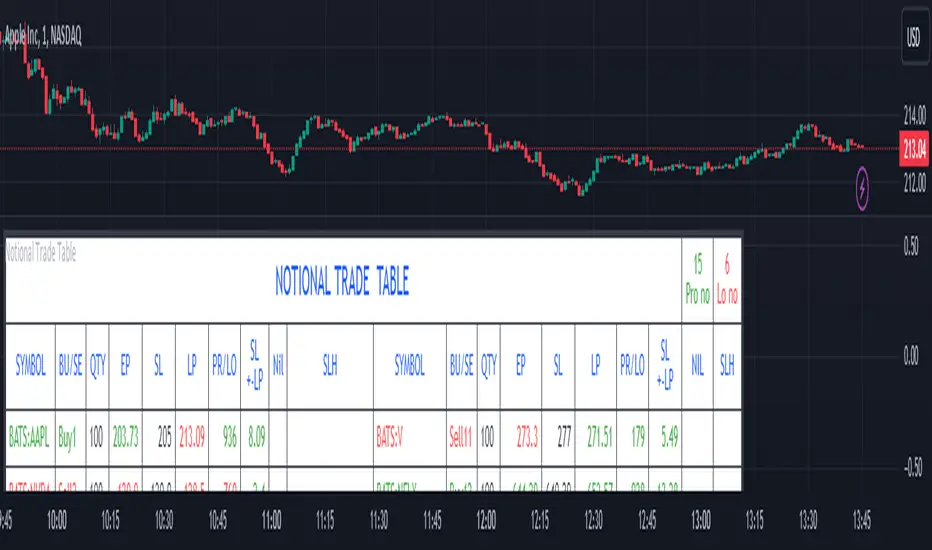
Wolf DCA CalculatorThe Wolf DCA Calculator is a powerful and flexible indicator tailored for traders employing the Dollar Cost Averaging (DCA) strategy. This tool is invaluable for planning and visualizing multiple entry points for both long and short positions. It also provides a comprehensive analysis of potential profit and loss based on user-defined parameters, including leverage.
Features
Entry Price: Define the initial entry price for your trade.
Total Lot Size: Specify the total number of lots you intend to trade.
Percentage Difference: Set the fixed percentage difference between each DCA point.
Long Position: Toggle to switch between long and short positions.
Stop Loss Price: Set the price level at which you plan to exit the trade to minimize losses.
Take Profit Price: Set the price level at which you plan to exit the trade to secure profits.
Leverage: Apply leverage to your trade, which multiplies the potential profit and loss.
Number of DCA Points: Specify the number of DCA points to strategically plan your entries.
How to Use
1. Add the Indicator to Your Chart:
Search for "Wolf DCA Calculator" in the TradingView public library and add it to your chart.
2. Configure Inputs:
Entry Price: Set your initial trade entry price.
Total Lot Size: Enter the total number of lots you plan to trade.
Percentage Difference: Adjust this to set the interval between each DCA point.
Long Position: Use this toggle to choose between a long or short position.
Stop Loss Price: Input the price level at which you plan to exit the trade to minimize losses.
Take Profit Price: Input the price level at which you plan to exit the trade to secure profits.
Leverage: Set the leverage you are using for the trade.
Number of DCA Points: Specify the number of DCA points to plan your entries.
3. Analyze the Chart:
The indicator plots the DCA points on the chart using a stepline style for clear visualization.
It calculates the average entry point and displays the potential profit and loss based on the specified leverage.
Labels are added for each DCA point, showing the entry price and the lots allocated.
Horizontal lines mark the Stop Loss and Take Profit levels, with corresponding labels showing potential loss and profit.
Benefits
Visual Planning: Easily visualize multiple entry points and understand how they affect your average entry price.
Risk Management: Clearly see your Stop Loss and Take Profit levels and their impact on your trade.
Customizable: Adapt the indicator to your specific strategy with a wide range of customizable parameters.

Smart Money Concept + Strategy Backtesting Toolkit [Shah]This indicator, primarily designed for strategy backtest. It’s important to emphasize that the orders generated by this indicator are in the form of stop-limit orders .
For Long setup , When lower lows and lower highs form, after price moving up from the last higher high, a “change of character” occurs. Entry will takes place in the golden zone.
This the Long setup:
And this is the Long setup Example on chart:
For Short setup , When higher lows and higher highs form after the price moves down from the last higher low, a “change of character” occurs. Entry will take place within the golden zone.
This the Short setup:
And this is the Short setup Example on chart:
Key Features:
Date Period:
Users can customize the date period during which the strategy is tested, allowing for a more granular analysis of performance over specific timeframes.
DCA Entry:
Entry is based on Fibonacci level between the Lower Low and Higher High pivots for Long deals .
Entry is based on Fibonacci level between the Higher High and Lower Low pivots for Short deals .
Allowing a second entry with a specified position size
Entering at a different price based on a Percent or ATR change.
There is a feature that If the risk-to-reward ratio is below the specified input (rr), the trading deal wont initiate, and the signal alert wont be triggered.
Stop Loss:
Adjustable based on Fibonacci levels , Percent and ATR.
The percent and ATR is calculate from LL pivot point for Long and HH pivot point for short (not Entry price)’
Targets:
Adjustable based on Source, Fibonacci levels , Percent and ATR.
Source indicates the maximum (minimum) value between the open and close of the candle where the Higher High (Lower Low) pivot point was formed for Long (Short) deals.
Percent and ATR calculates from Entry 1 Price
There is a feature that closes the part of the position size at Target 1 based on a percentage, leaving the rest to close at Target 2, entry, exit price, or stop loss.
Plots:
The visual representation of the indicator includes the key plots:
Reset Deal Calculation Fibonacci Level
Alert Fire Fibonacci Level
Entry 1
Entry 2
Entry Average
Stop Loss
Target 1
Target 2
Labels:
Displays informative labels upon trade open and close, providing details about each transaction like gain and equity and etc.
Risk Management:
Allows setting initial capital, risk per trade, and commission for each transaction.
Score Table:
Provides statistical information for Regular deals (refers to deals that closed in Target price or Stop loss price) and Exited deals (representing deals that didn’t touch the stop loss or targets.):
Number of trades
Win rate
Profit factor
Average Risk to Reward ratio
Total Profit and Loss (PnL)
Commission paid
Live equity
It should note that Winrate calculated based on closed deals at target or stop loss. (Exited trades doesn’t into account in calculation of Winrate)
Exit Methods :
The goal is to offer users a diverse set of exits before the price touches the target or stop loss.
1. Pending Entry Time-out
cancel pending entry based on candle counting since alert fired. (before deal started)
2. Break Even
If Target 2 is reached, the stop loss automatically adjusts to the entry price.
3. Active Deal Reverse
If a deal (long or short position) is currently open, and the reverse signal is emitted, the script will close the existing deal.
4. Reverse Deal Exit
If a deal (long or short position) is currently open, and the reverse signal is emitted, the script will automatically close the existing deal.
5. Move Exit
With this method, if Entry 2 is triggered, the deal will be closed when the price touches the Entry price.
6. Candle Counting Exit
This exit type is based on the number of candles since the deal started.
7. Profit Zone Shield Exit
Once a deal enters profit, the Exit level moves to the entry level after reaching a Fibonacci level between TP1 and Entry 1.
Deep Backtesting Table:
It includes:
Time period of the backtest
Pair name and timeframe
Count the long and short trades
Win streak and loss streak
Total deal chances and missed chances
Count the deals goes directly from entry 1 to tp1 and entry 2 to tp1
Count the deals that touched entry 2 and entry 2 filled percent
Count the number of each exit type
Other statistics such as CAGR, Sharpe, Kurtosis, Skewness, and Max Drawdown.

Bounce Manager TrendlinesThe trendline script is made for manual input of trendlines using point clicks on the chart. The script will then see if price respects these lines by the parameters you input in settings panel. On a respectable bounce it will print buy/sell arrows. The script also has functionality to send alerts, this is helpful if you want to automate trendlines . I created this script and many others under the bounce manager toolkit to expand on the signalling capabilities of popular drawing tools as I find using just a crossover to be lacking especialy for full automation.
components:
- Line respect: When price moves past this the script will no longer look for entry until a new trend has been established. The line can also be used as a stop loss.
- Confirmation: When price touches the line during a trend it
will wait to cross over this line to confirm a reaction from the line.
- Consolidation filter: A trend filtering system, this is a distance from
the line price has to break to confirm trend direction.
- Stop loss: This can be set to a percentage distance from the low after
bounce. Or it can be set to the line respect line
- Take profit: This can be a fixed take profit target or a risk to reward
based take profit. With risk to reward it will multiply the stop loss
distance by the input and use that to create target (green cross)
- ATR based or % based: there are 2 versions of the script, one for strict
percentage based logic and another one based on ATR values
If you are having problems figuring out which settings to use I recommend you check the Bounce Manager ATR script for reference as this script plots the components:
Zignaly automation settings:
zignaly integration, you can use the settings panel to decide your risk management. Option to use a fixed take profit % or an automatic risk to reward calculation based on the stop loss. Stop loss can get calculated using the max violation setting as a stop loss (this will put stop loss below line respect level) or when not checked it will use 0.01% below the low of the signal candle as stop loss. Just add your zignaly private key in the settings and use any alert function call as alert. Make sure to use zignaly.com as your webhook url.
If 5 trendlines are not enough use the 20 line input version, this script is for the clean strong trendline trader.
Part of the Honest Algo indicator suite

Bounce Manager 20 TrendlinesThe trendline script is made for manual input of trendlines using point clicks on the chart. The script will then see if price respects these lines by the parameters you input in settings panel. On a respectable bounce it will print buy/sell arrows. The script also has functionality to send alerts, this is helpful if you want to automate trendlines. I created this script and many others under the bounce manager toolkit to expand on the signalling capabilities of popular drawing tools as I find using just a crossover to be lacking especialy for full automation.
components:
- Line respect: When price moves past this the script will no longer look for entry until a new trend has been established. The line can also be used as a stop loss.
- Confirmation: When price touches the line during a trend it
will wait to cross over this line to confirm a reaction from the line.
- Consolidation filter: A trend filtering system, this is a distance from
the line price has to break to confirm trend direction.
- Stop loss: This can be set to a percentage distance from the low after
bounce. Or it can be set to the line respect line
- Take profit: This can be a fixed take profit target or a risk to reward
based take profit. With risk to reward it will multiply the stop loss
distance by the input and use that to create target (green cross)
- ATR based or % based: there are 2 versions of the script, one for strict
percentage based logic and another one based on ATR values
If you are having problems figuring out which settings to use I recommend you check the Bounce Manager ATR script for reference as this script plots the components:
Zignaly automation settings:
zignaly integration, you can use the settings panel to decide your risk management. Option to use a fixed take profit % or an automatic risk to reward calculation based on the stop loss. Stop loss can get calculated using the max violation setting as a stop loss (this will put stop loss below line respect level) or when not checked it will use 0.01% below the low of the signal candle as stop loss. Just add your zignaly private key in the settings and use any alert function call as alert. Make sure to use zignaly.com as your webhook url.
The trendlines you see in preview are based on a long term pitchfork on BTCUSDT 10H chart
If 20 trendlines are too much I will be releasing a 5 line input version, this script is more to be used to automate pitchforks, gann boxes etc.
Part of the Honest Algo indicator suite
